When Dravec got banned, the CDL split into two groups
Analysis
When Dravec got banned, the CDL split into two groups. One kept improving. One didn’t.
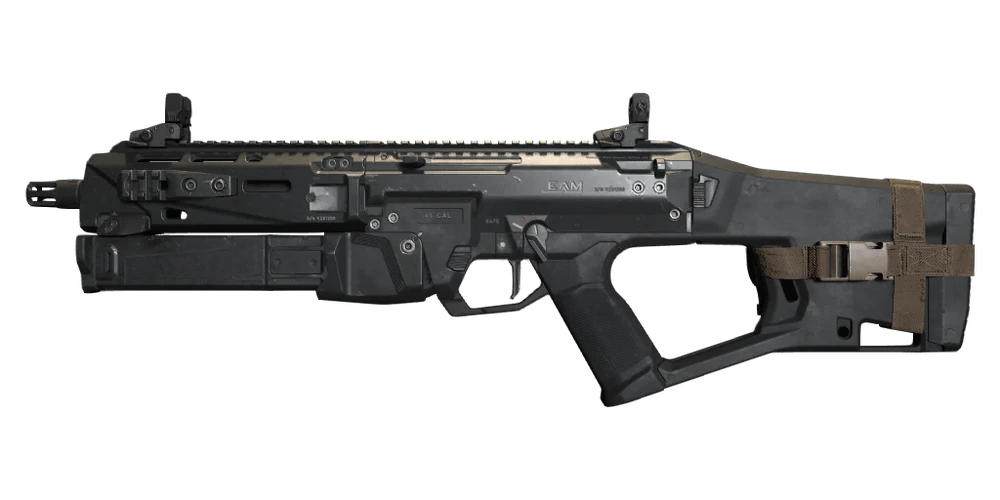
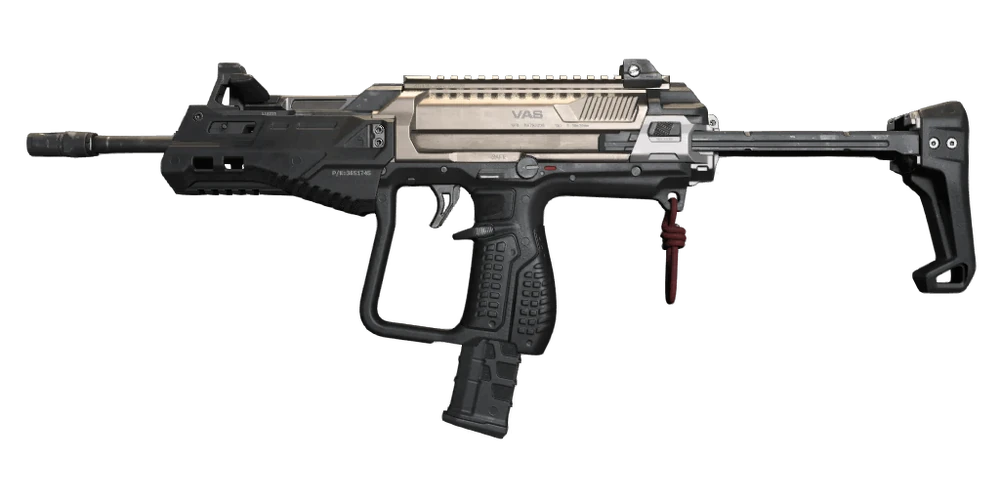
Images: Call of Duty Wiki, Fandom
For Major 3, CDL pros moved from the Dravec 45 to the MPC-25. If you split the league’s players by which weapon class they primarily run, AR or SMG, and track every one of them across the season, something clean shows up: the two groups moved in opposite directions right around that switch, and it isn’t close.
Weekly K/D, AR vs. SMG players
Before the cutover, the AR line sits at or above the SMG line in almost every week, sometimes by a wide margin, the expected shape, given AR was the season’s dominant weapon class up to that point. From the week containing April 17 onward, that flips. SMG is at or above AR in most of the remaining weeks. The crossover lands almost exactly where the meta change should put it, which is a decent sign this isn’t an arbitrary line drawn through noise.
The numbers behind the lines
10 AR players and 10 SMG players, K/D and Breaking Point’s own composite rating, each player’s matches before April 17 against everything from April 17 on. Both groups were drawn from EntryData’s top-ranked players by season-long value, not a random sample, so this is a look at how the meta change affected the league’s best, not the field as a whole.
Mean change per group
| Group | Δ K/D | Δ BP rating | Improved |
|---|---|---|---|
| AR (10 players) | -0.034 | -0.035 | 3 / 10 |
| SMG (10 players) | +0.021 | +0.016 | 8 / 10 |
| League-wide | -0.000 | +0.000 | n/a |
BP rating is the more telling of the two numbers, because it’s already built mode-by-mode rather than pooling raw kills across a season that’s mostly Hardpoint by kill-count. By that measure the split is even cleaner than K/D: 0 of 10 AR players’ ratings improved after the cutover; 6 of 10 SMG players did. A K/D-only version of this story could plausibly be waved off as “AR players ran into a rough stretch on Hardpoint,” but a mode-adjusted rating moving the same direction, for the same players, rules that out.
K/D swing by player
Full player list
| Player | Before | After | Δ |
|---|---|---|---|
| RenKoR | 1.167 | 1.043 | −0.124 |
| Mercules | 1.116 | 1.016 | −0.100 |
| Nium | 1.008 | 0.955 | −0.052 |
| Scrap | 1.068 | 1.024 | −0.043 |
| Ghosty | 1.059 | 1.018 | −0.041 |
| Abuzah | 1.085 | 1.049 | −0.036 |
| Drazah | 1.018 | 0.988 | −0.031 |
| Cellium (AR) | 1.126 | 1.138 | +0.012 |
| Kips (AR) | 1.020 | 1.053 | +0.033 |
| Dashy (AR) | 1.030 | 1.071 | +0.041 |
| Simp | 1.114 | 1.076 | −0.038 |
| Pred | 1.079 | 1.068 | −0.011 |
| Huke | 1.026 | 1.035 | +0.009 |
| HyDra | 1.053 | 1.070 | +0.017 |
| Shotzzy | 1.022 | 1.040 | +0.019 |
| aBeZy | 1.013 | 1.041 | +0.028 |
| JoeDeceives | 1.120 | 1.155 | +0.034 |
| Kremp | 1.011 | 1.051 | +0.040 |
| 04 | 0.964 | 1.020 | +0.056 |
| Estreal | 1.001 | 1.062 | +0.061 |
Cellium, Kips, and Dashy are the three exceptions inside the AR group, and all three are worth naming rather than folding into the group average and moving on. Their gains are small, nowhere near enough to offset the group’s overall decline, but a group with zero exceptions at all would be more suspicious than one with a few modest ones.
It’s concentrated in one mode
Splitting by mode sharpens the picture further. Search & Destroy, the mode built around one-life engagements and holding sightlines, the classic AR strength, shows by far the widest gap between groups. Overload, generally the more mobility-friendly and objective-focused mode, is close to a wash for both.
Δ K/D by mode
| Mode | AR group | SMG group | Gap |
|---|---|---|---|
| Hardpoint | -0.036 | +0.024 | 0.06 |
| Search & Destroy | -0.076 | +0.060 | 0.14 |
| Overload | -0.031 | +0.001 | 0.03 |
A 0.14 K/D swing between the two groups in Search & Destroy alone – more than 2x the Hardpoint gap – is a big number for one mode. It’s also the cleanest evidence that this is really about weapon class and not some unrelated thing that happened to two arbitrary groups of players at the same time; a coincidence wouldn’t have a reason to concentrate itself in exactly the mode where the weapon change would matter most.
One speculative reason the gap concentrates there specifically, offered as a guess rather than something this data can confirm: Search & Destroy has no respawns, so whatever weapon a player picks has to carry the whole round rather than just the next life, which may push AR players toward their primary more consistently there. In the respawn modes (Hardpoint, Overload), a weapon choice only ever has to work until the next death, so flexing onto an SMG for a close-range moment costs less. If that’s right, the “AR group” is more purely AR in Search & Destroy than it is in the other two modes, which would blur the effect in exactly the modes where it shows up smallest. Not something the box scores can verify either way.
One roster, same games, opposite outcomes
Every player above faced a different schedule, which leaves room to wonder whether opponent strength or map pool drifted for one group more than the other over the season. LA Thieves closes that gap, because all four of its classified players played the exact same matches. Two are AR. Two are SMG.
LA Thieves, before → after, same roster
Four for four. Both AR players came down, both SMG players went up, on the same team, in the same games. Nothing about opponent difficulty or scheduling explains that split away; the only thing that differs between these four players is which weapon class each one runs.
It doesn’t show up in who won
The obvious next question: did any of this actually cost teams series? Team-by-team series win rate, same cutover, for every team with a classified player on the roster.
Team series win%, before vs. after
| Team | Before | After | Δ |
|---|---|---|---|
| Los Angeles Thieves | 56.0% | 79.4% | +23.4pp |
| Toronto KOI | 46.2% | 53.6% | +7.4pp |
| Riyadh Falcons | 52.2% | 56.7% | +4.5pp |
| OpTic Texas | 76.9% | 73.5% | -3.4pp |
| Miami Heretics | 52.2% | 46.7% | -5.5pp |
| FaZe Vegas | 65.5% | 60.0% | -5.5pp |
| Paris Gentle Mates | 55.6% | 50.0% | -5.6pp |
| G2 Minnesota | 48.0% | 40.7% | -7.3pp |
This is where the story stops being tidy, and it’s worth reporting exactly that rather than forcing it. There’s no relationship at all between a team’s AR/SMG mix and how its win rate moved. LA Thieves is the team with the cleanest individual-level split of anyone in this piece, both AR players down, both SMG players up, and its win rate jumped more than any other team. G2 Minnesota’s only classified player (Kremp, SMG) individually improved, and the team’s win rate dropped more than anyone’s.
The weapon-class effect looks real at the player level and doesn’t survive contact with actual results. Team success runs through far more than one stat line, and this data can’t say it decided a single series.
That’s not a contradiction so much as a scope limit. A player’s individual K/D and rating are close to the weapon change and not much else. A team’s win-loss record runs through the other three or four roster spots, the opposing team’s form that week, timeouts, map picks, coaching adjustments, and a dozen things this dataset doesn’t see. The honest version of this piece is about how a meta change altered what individual players’ box scores looked like, not a claim that it swung anyone’s season.
What this isn’t
Breaking Point’s data has no weapon field anywhere in it: nothing here can independently verify which weapon any player actually used on any given map. The AR/SMG grouping is a real, informed classification, not something pulled from the data itself, and it should be read that way. Sample sizes are modest, roughly 90 to 130 maps per player on each side of the cutover, small enough that any one player’s number could be noisy even where the group pattern looks clean. And this window wasn’t weapon-change-only: JoeDeceives switched teams inside it, and a shifting map pool could nudge a player’s numbers independent of anything to do with a gun.
There’s also a more specific version of the season-long-improvement problem worth naming directly: AR tends to have a real edge early in a season regardless of any patch, since SMG players are still learning the routes, counters, and map knowledge that make an SMG effective against an AR at range. If that pattern held this season too, some of the “before” period’s AR advantage and some of the “after” period’s SMG improvement could just be that normal early-season gap closing on its own, not the meta change specifically. This data can’t separate the two effects apart from noting they’d both push in the same direction as what’s reported here.
What holds up despite all of that: two independently-classified groups of ten, tracked on two different stats, moved in opposite directions right around a real meta change; the gap concentrates in exactly the mode you’d expect if the mechanism were real; and one roster’s internal split lines up perfectly with the league-wide one. That’s a real pattern in the box scores. Whether it’s the whole story of anyone’s season is a different, much bigger question, and this piece isn’t trying to answer it.