MAPS
By map
Pick a season and a map to see how it plays: how often it comes up, and which teams and players win on it in each mode.
Offseason · last match Aug 9, 2026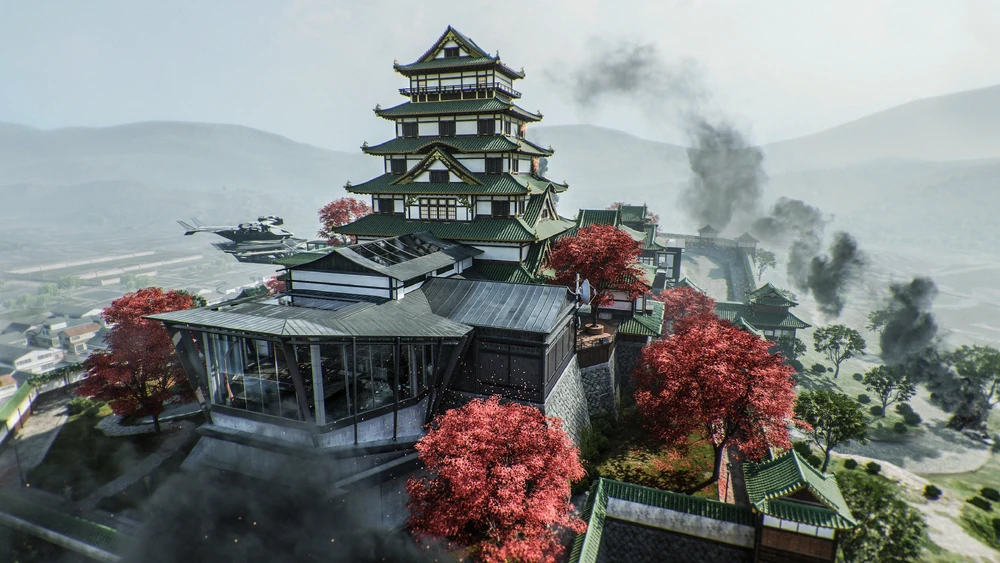 Den
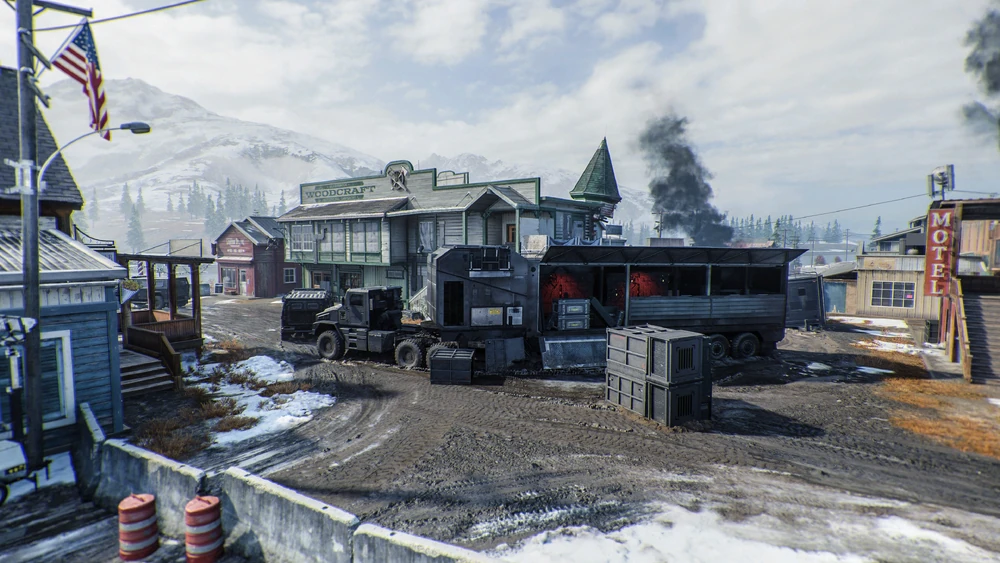 Scar
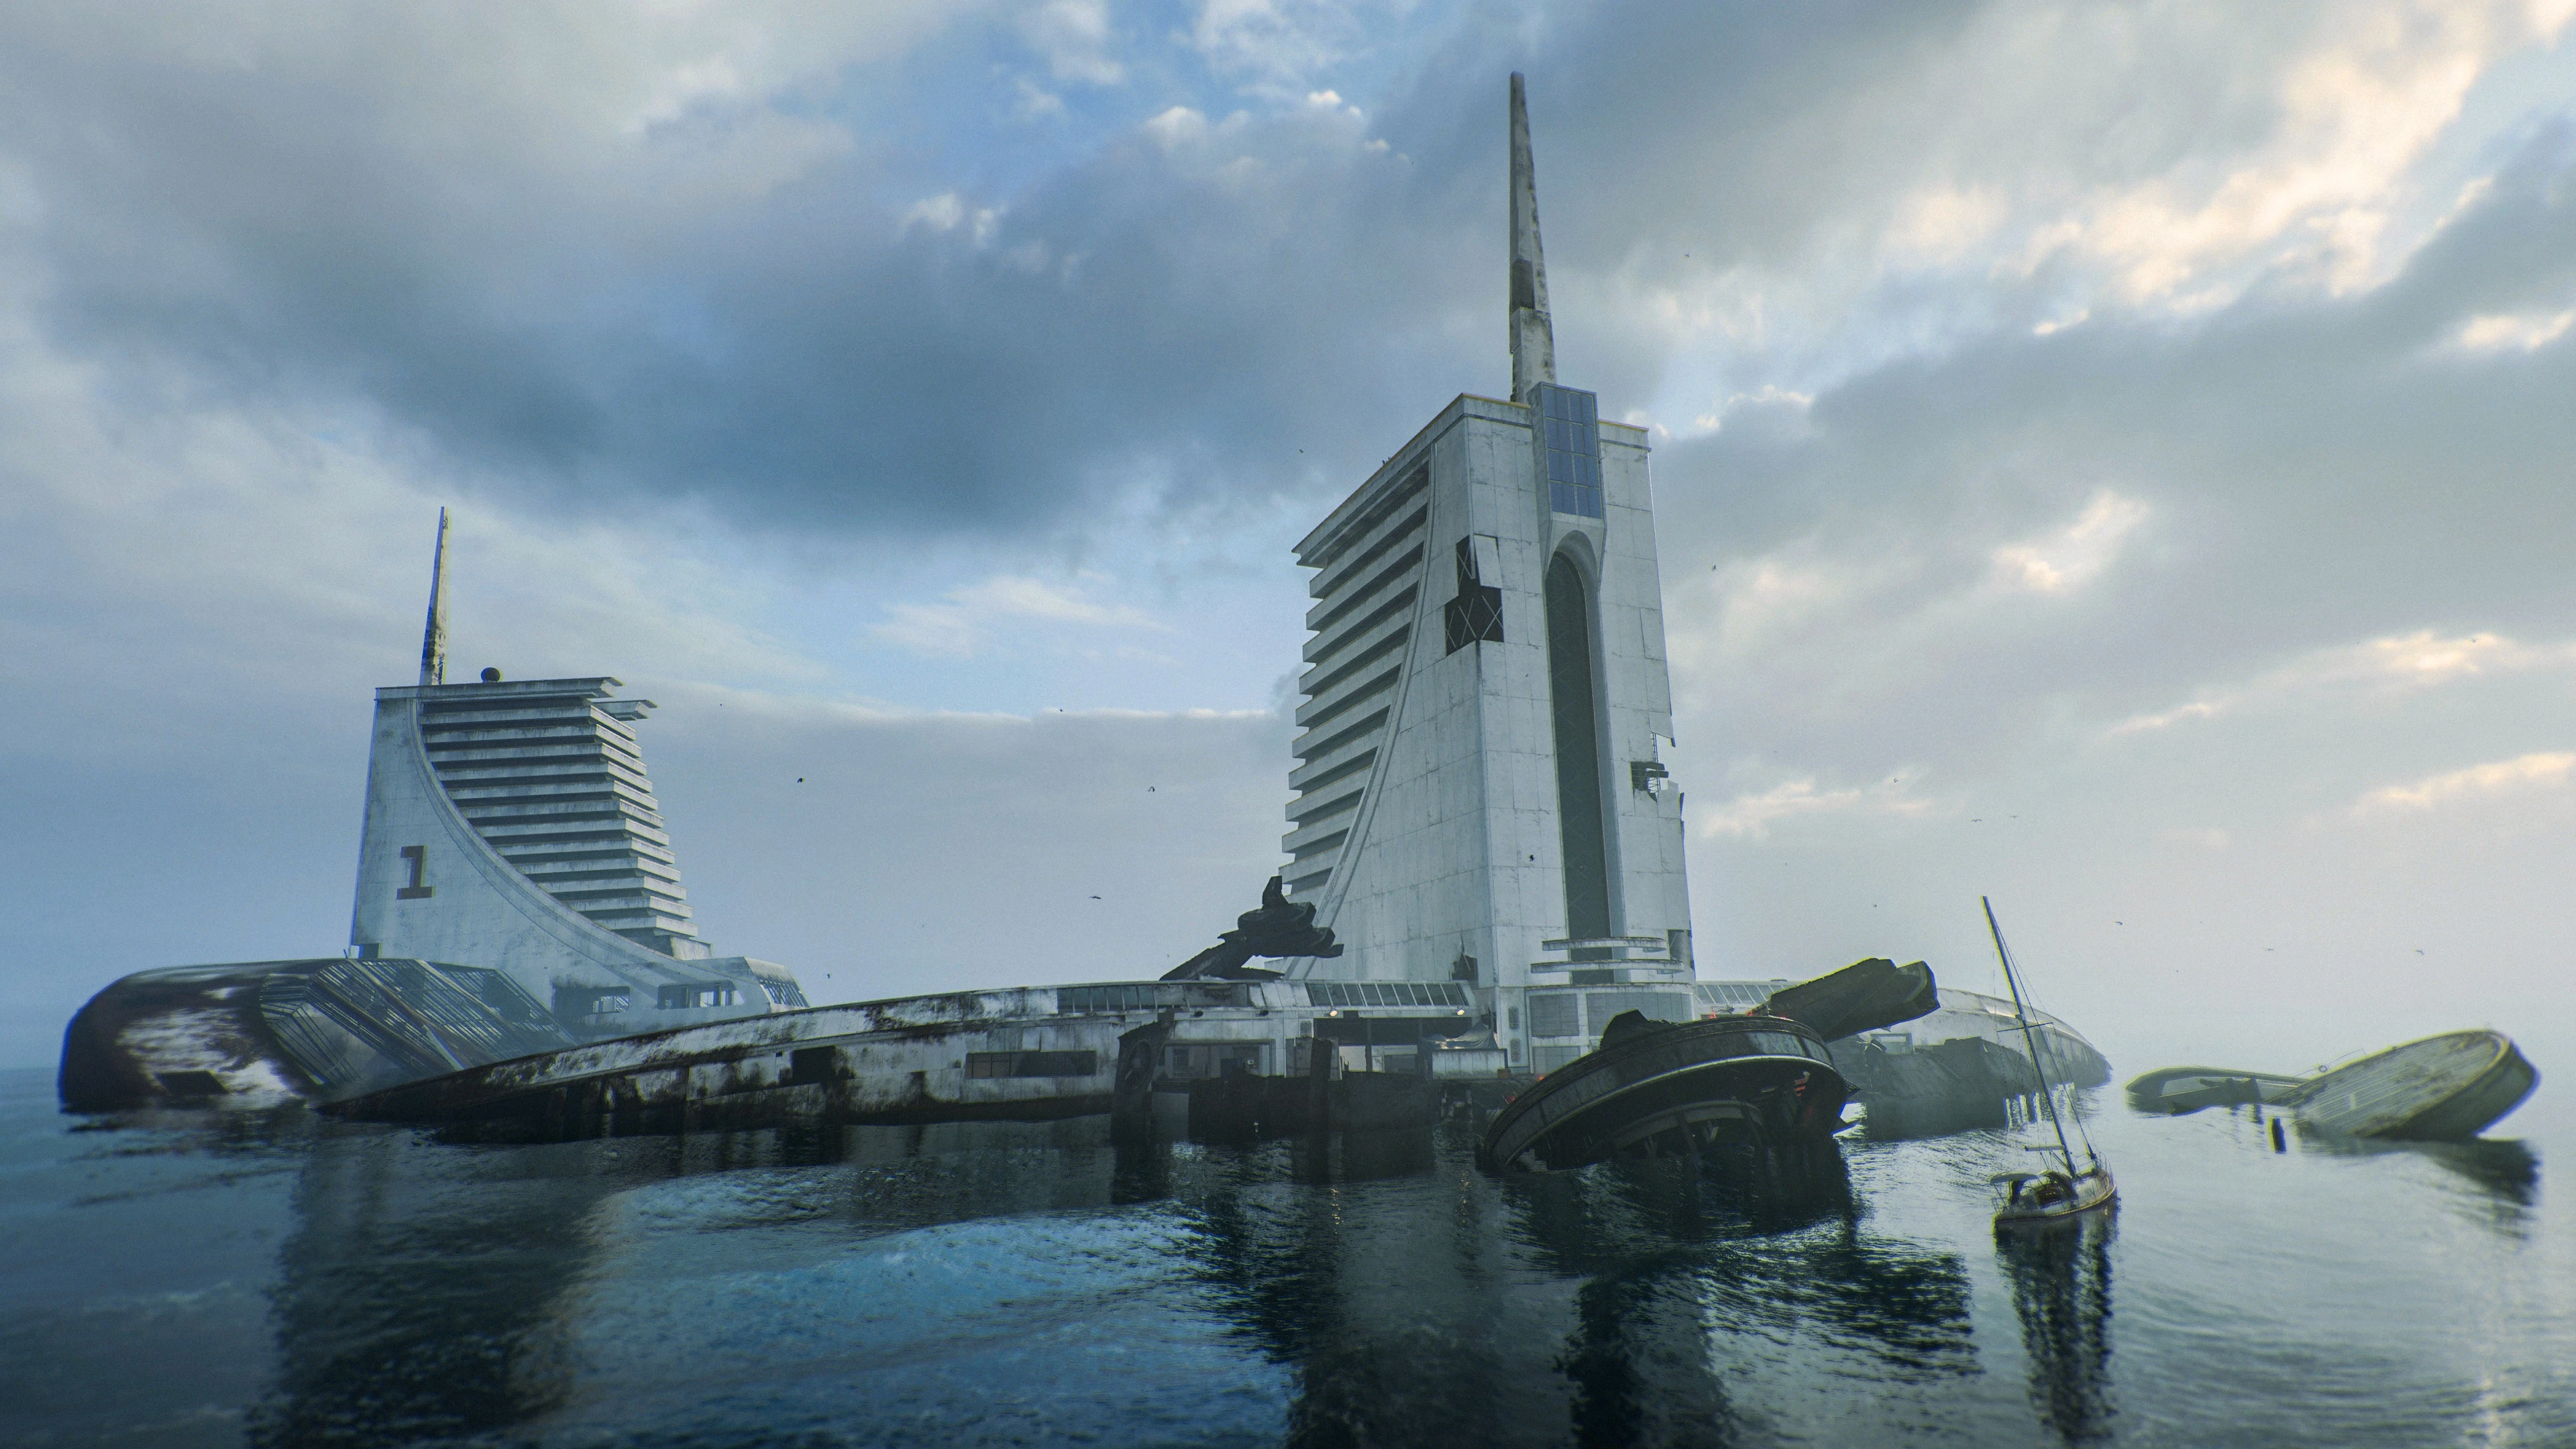 Colossus
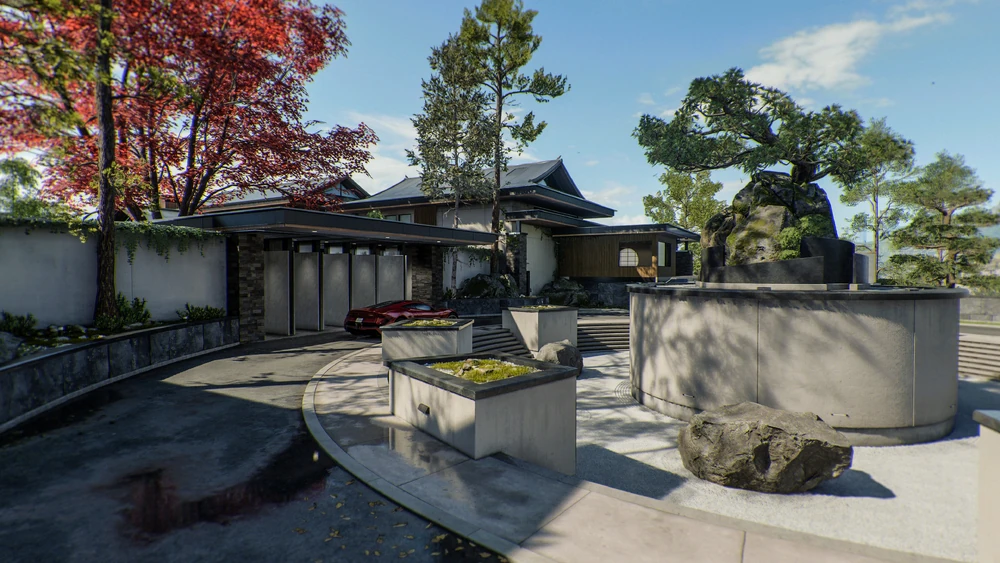 Raid
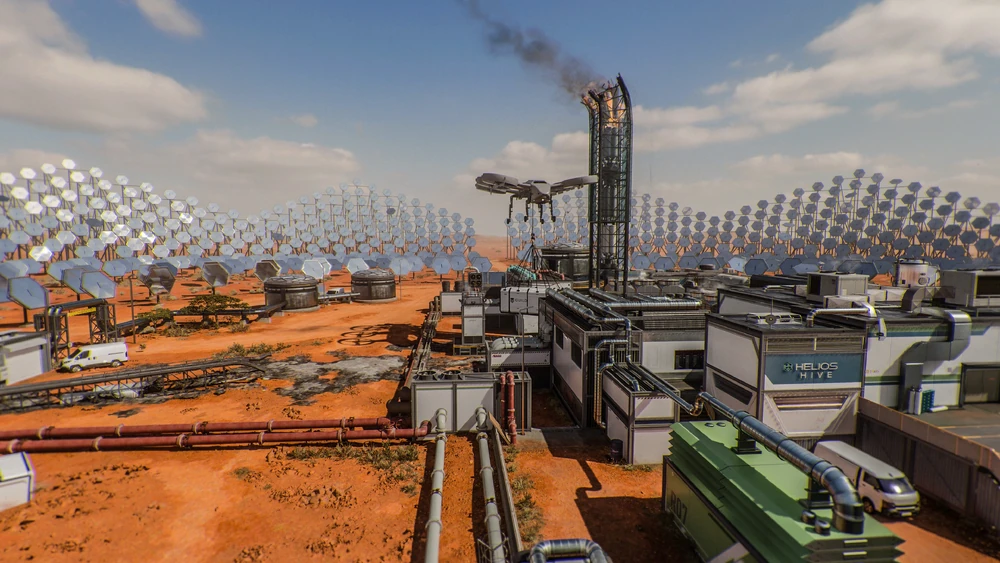 Exposure
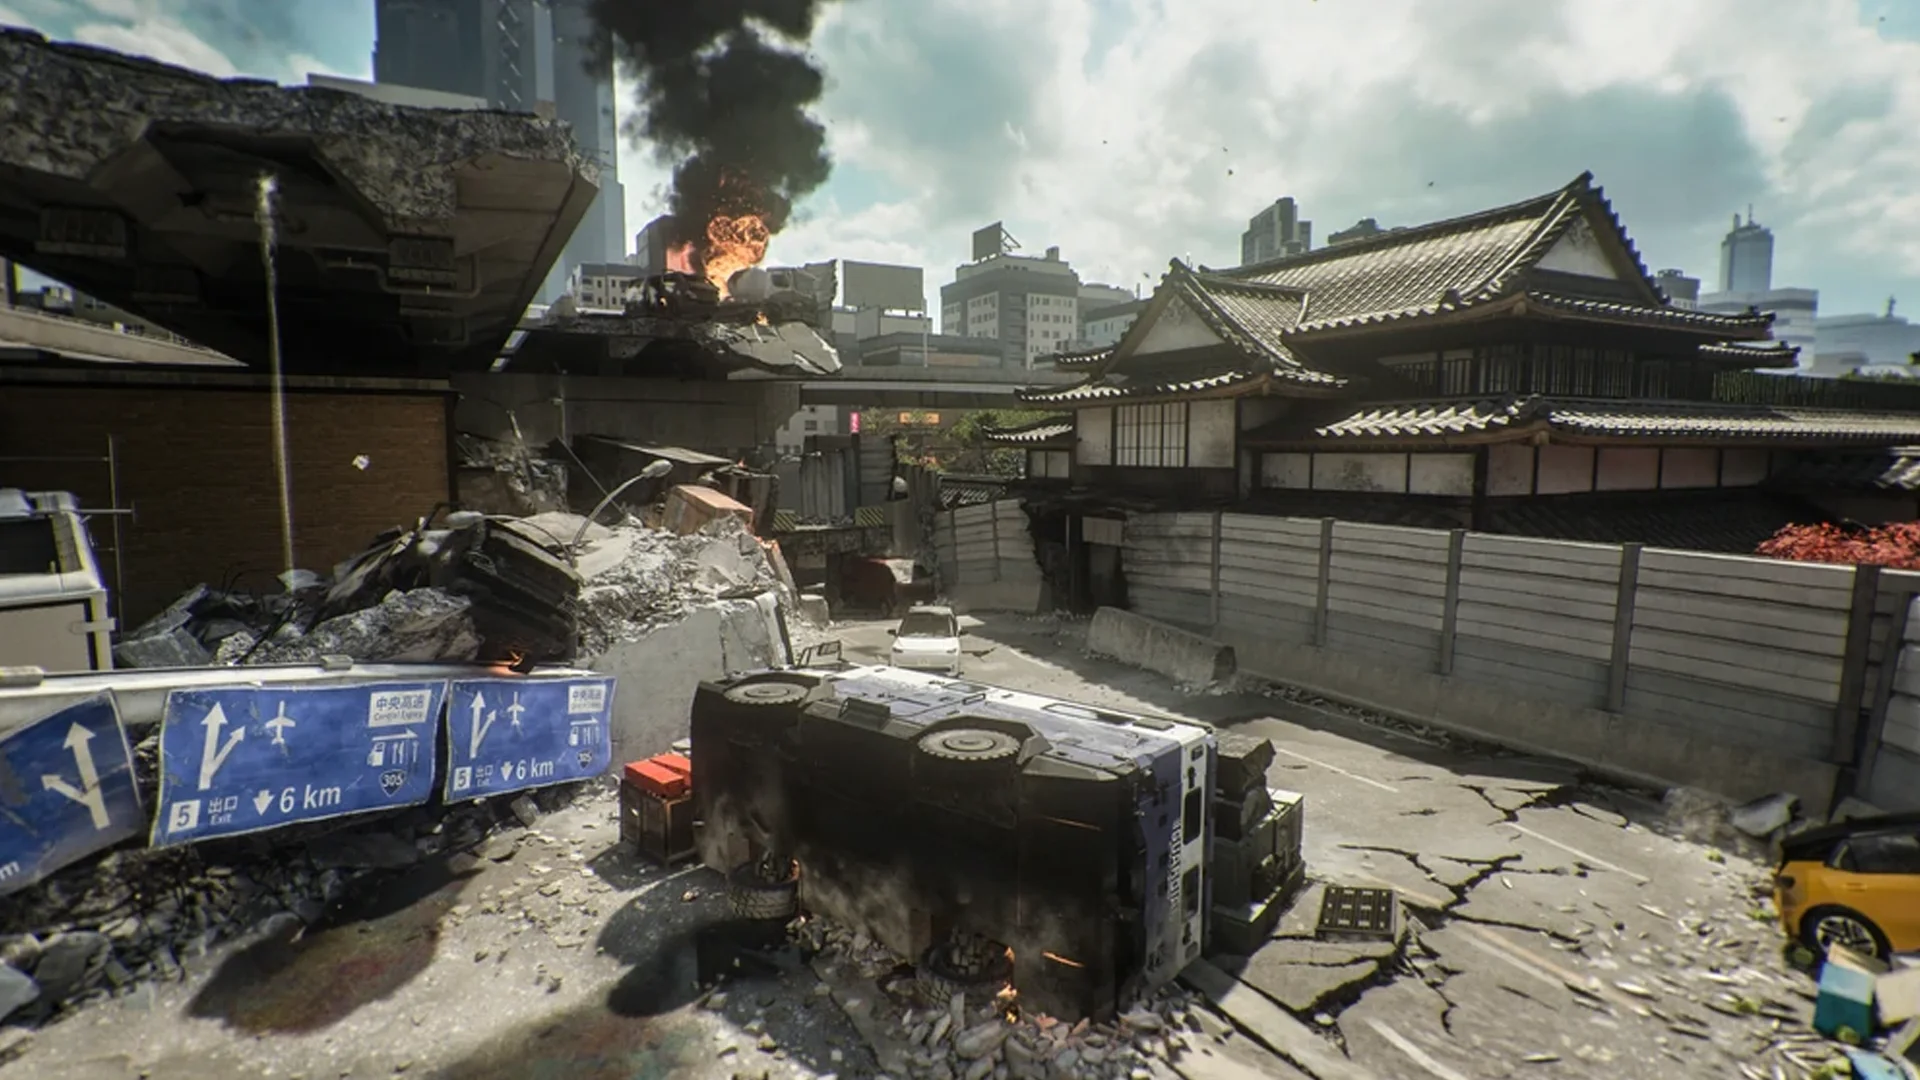 Gridlock
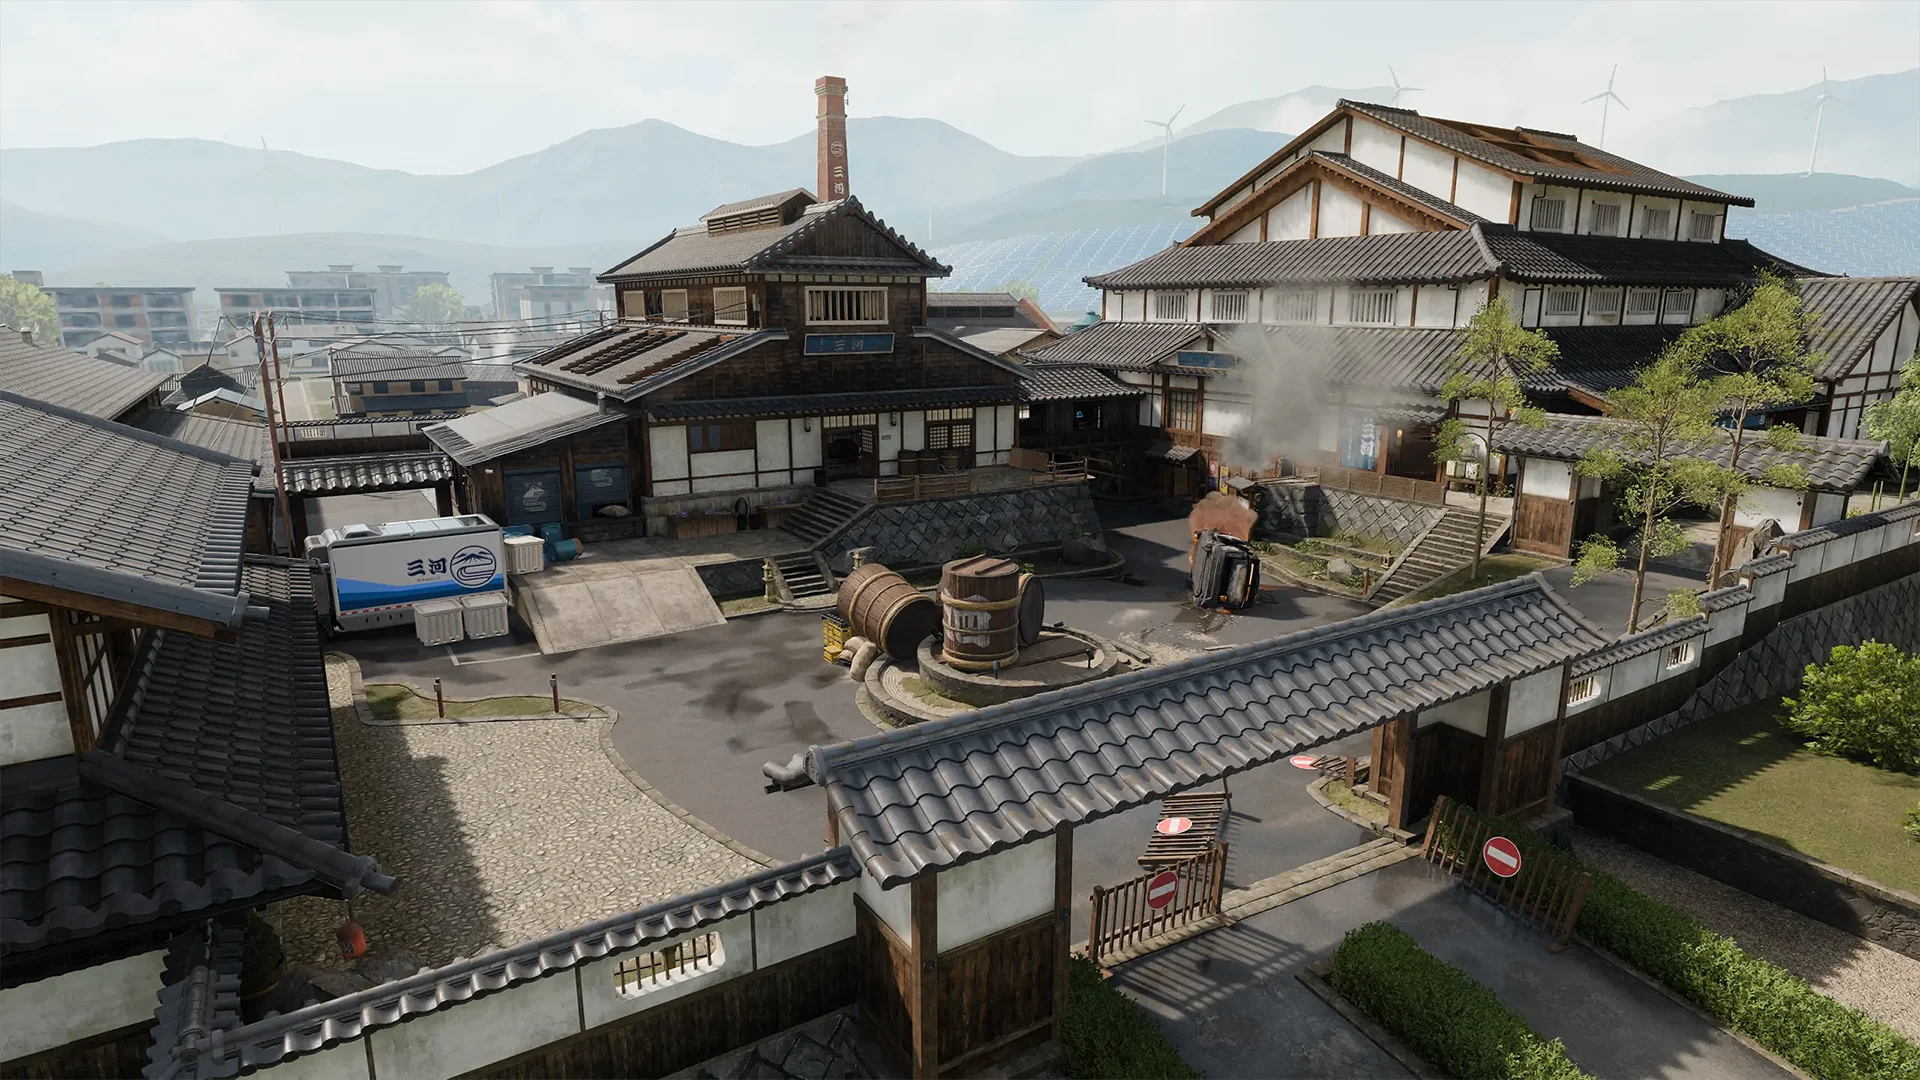 Sake
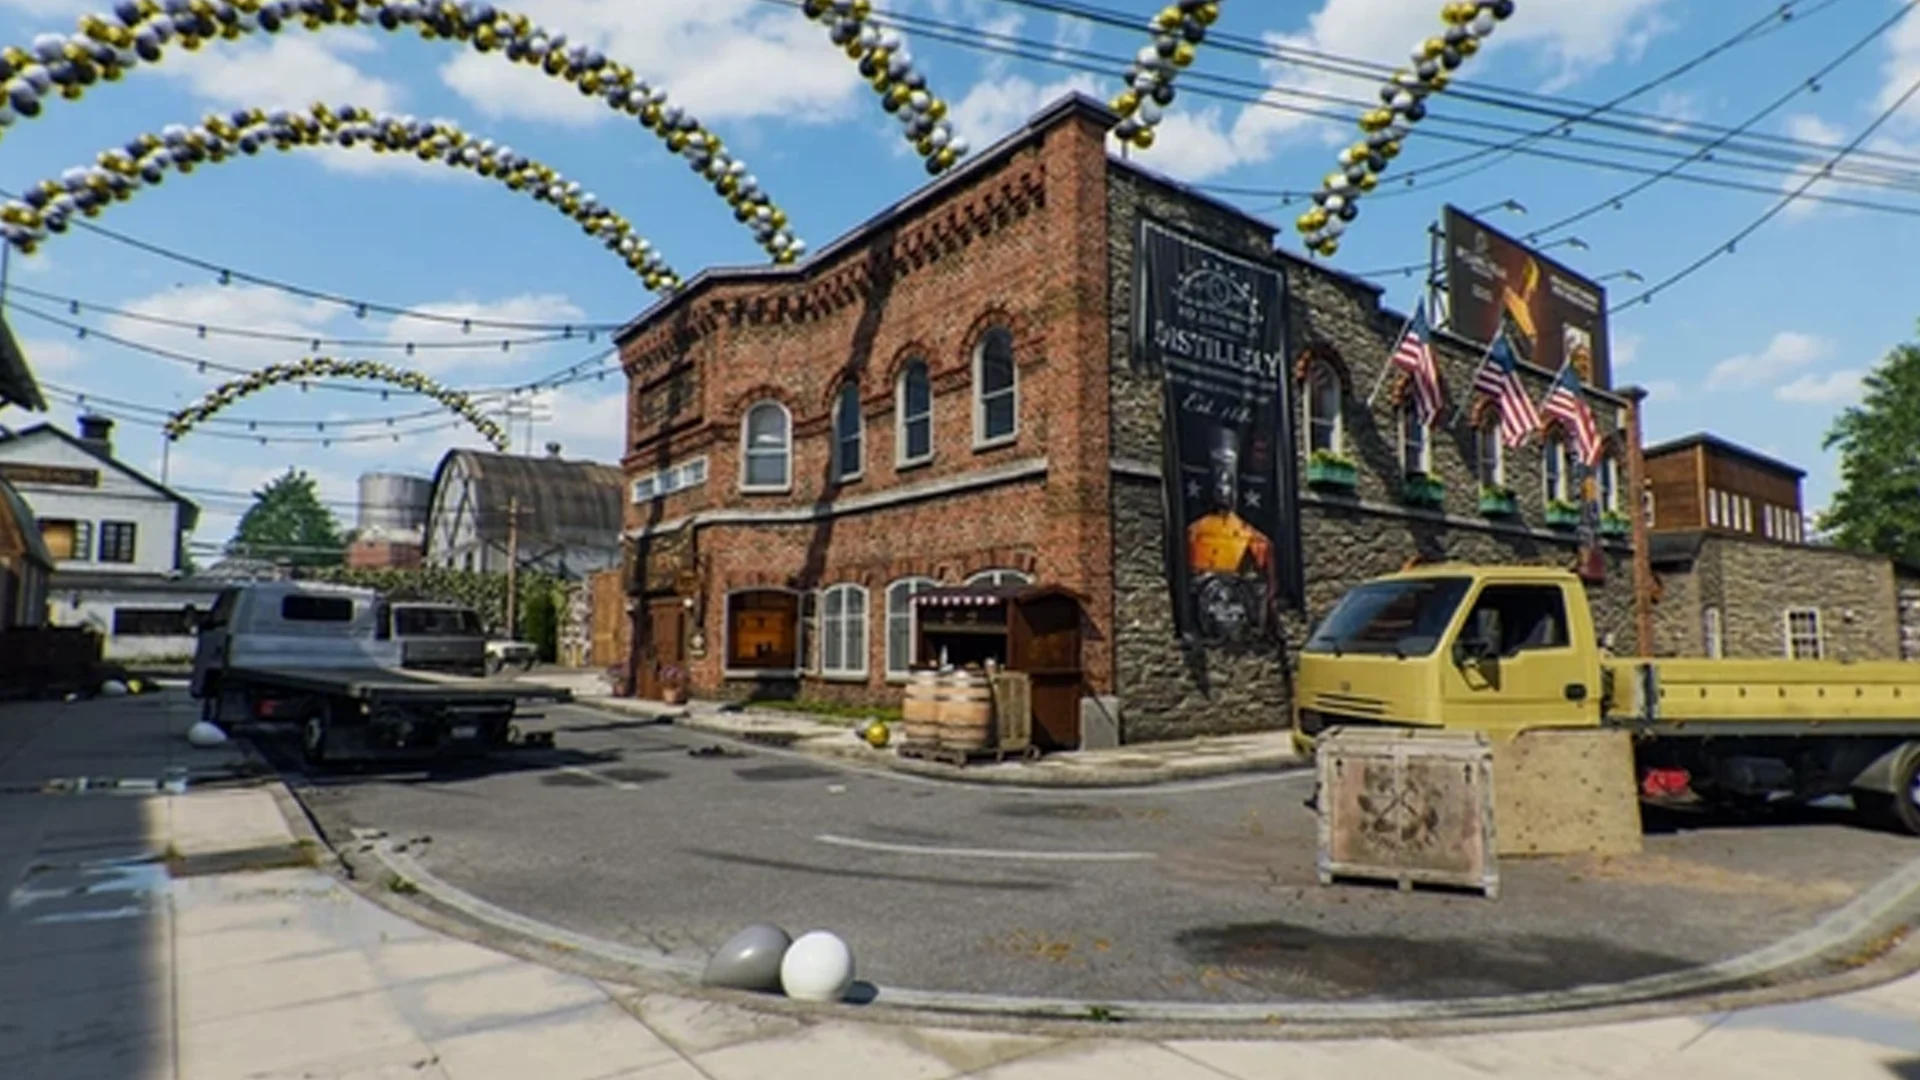 Fringe
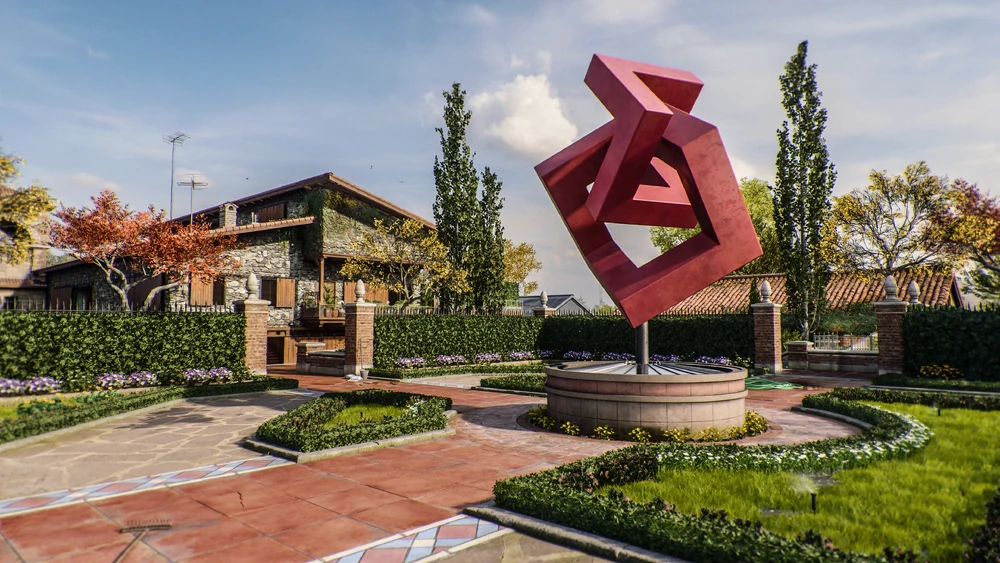 Hacienda
 6 Star
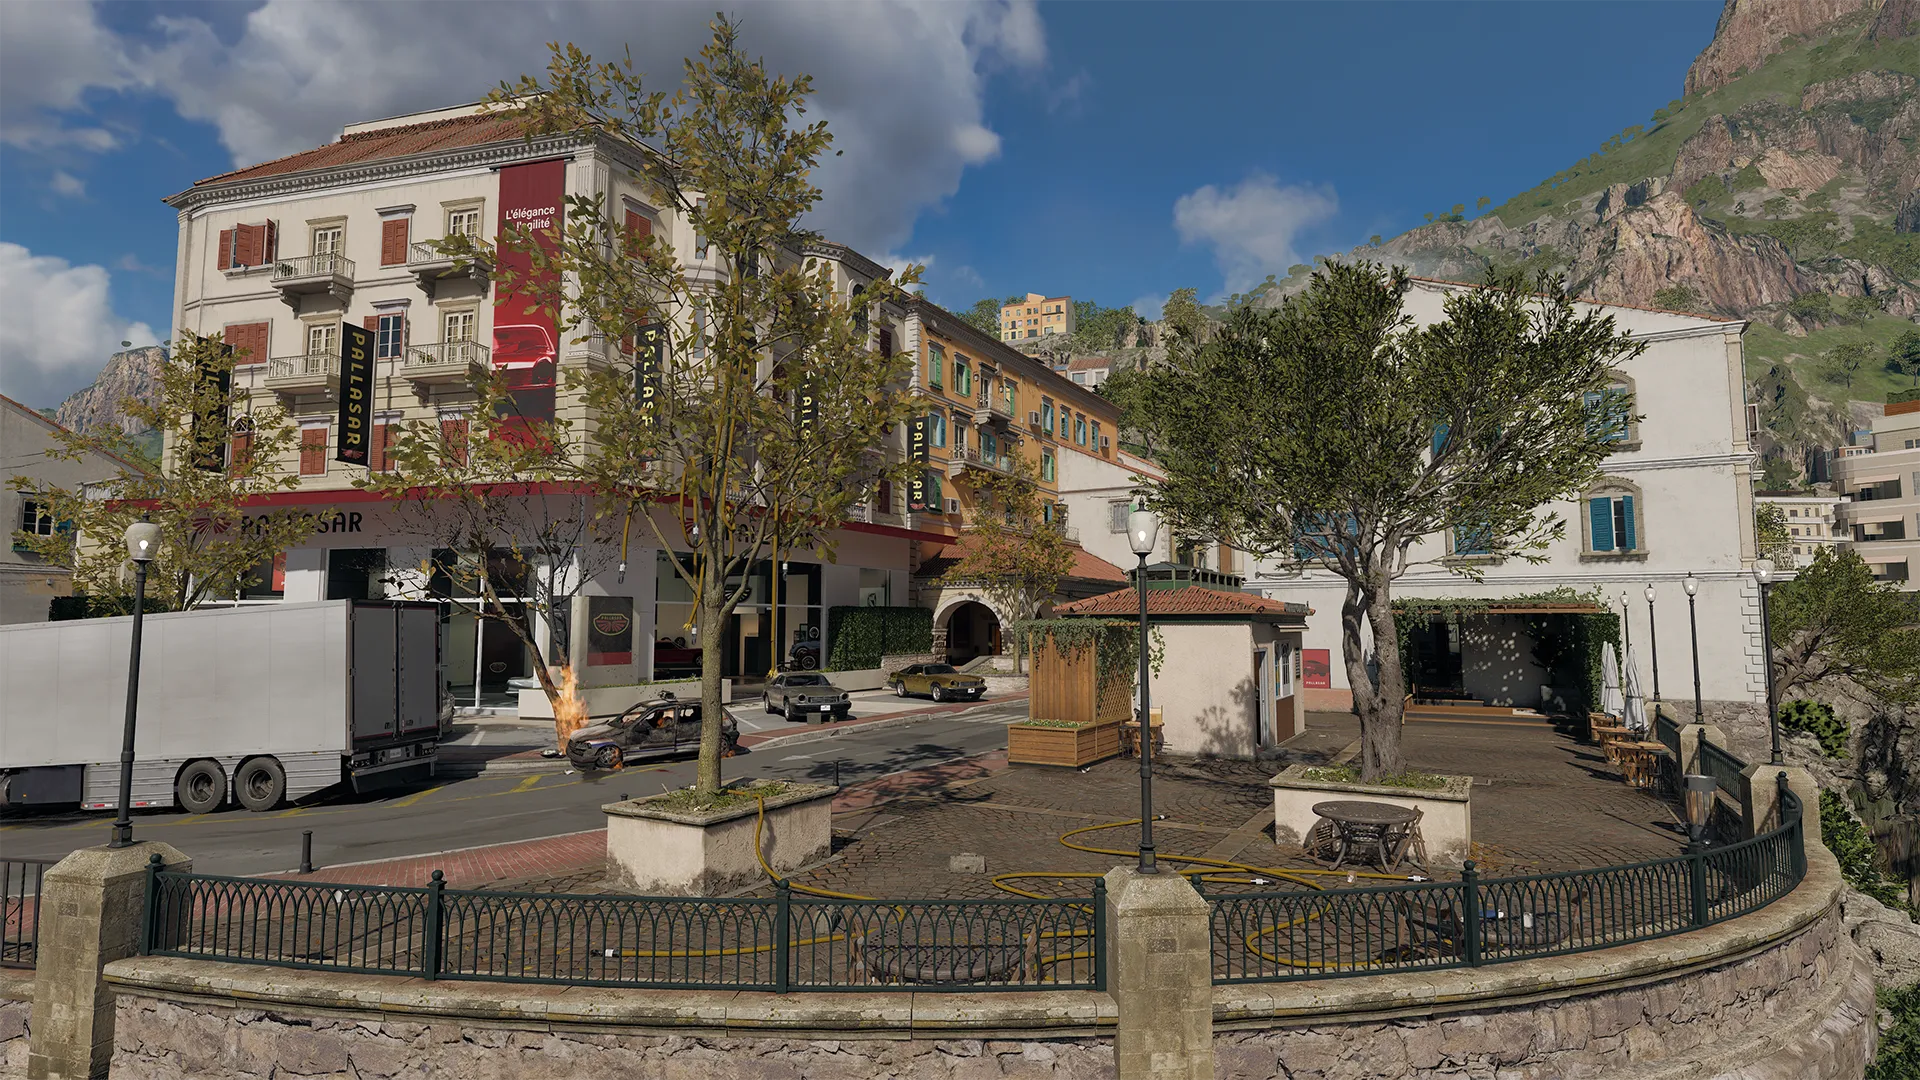 Dealership
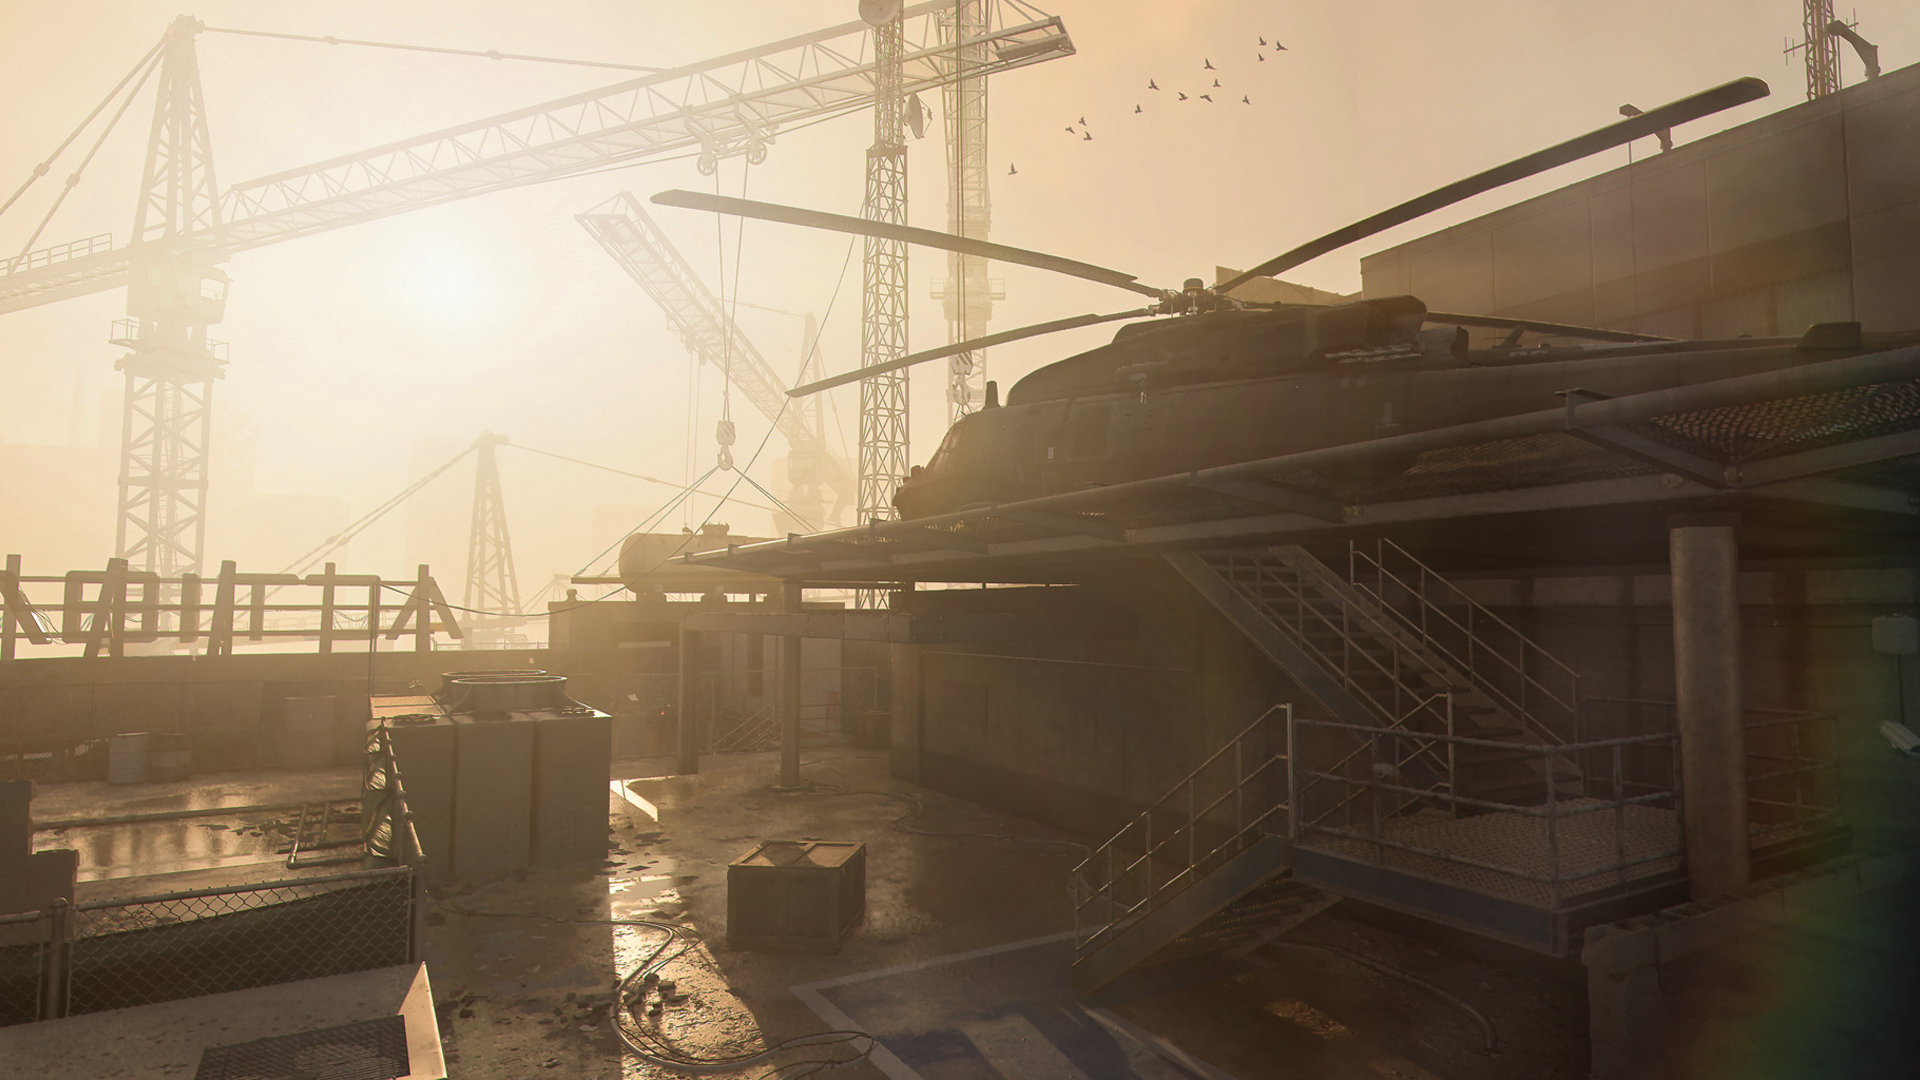 Highrise
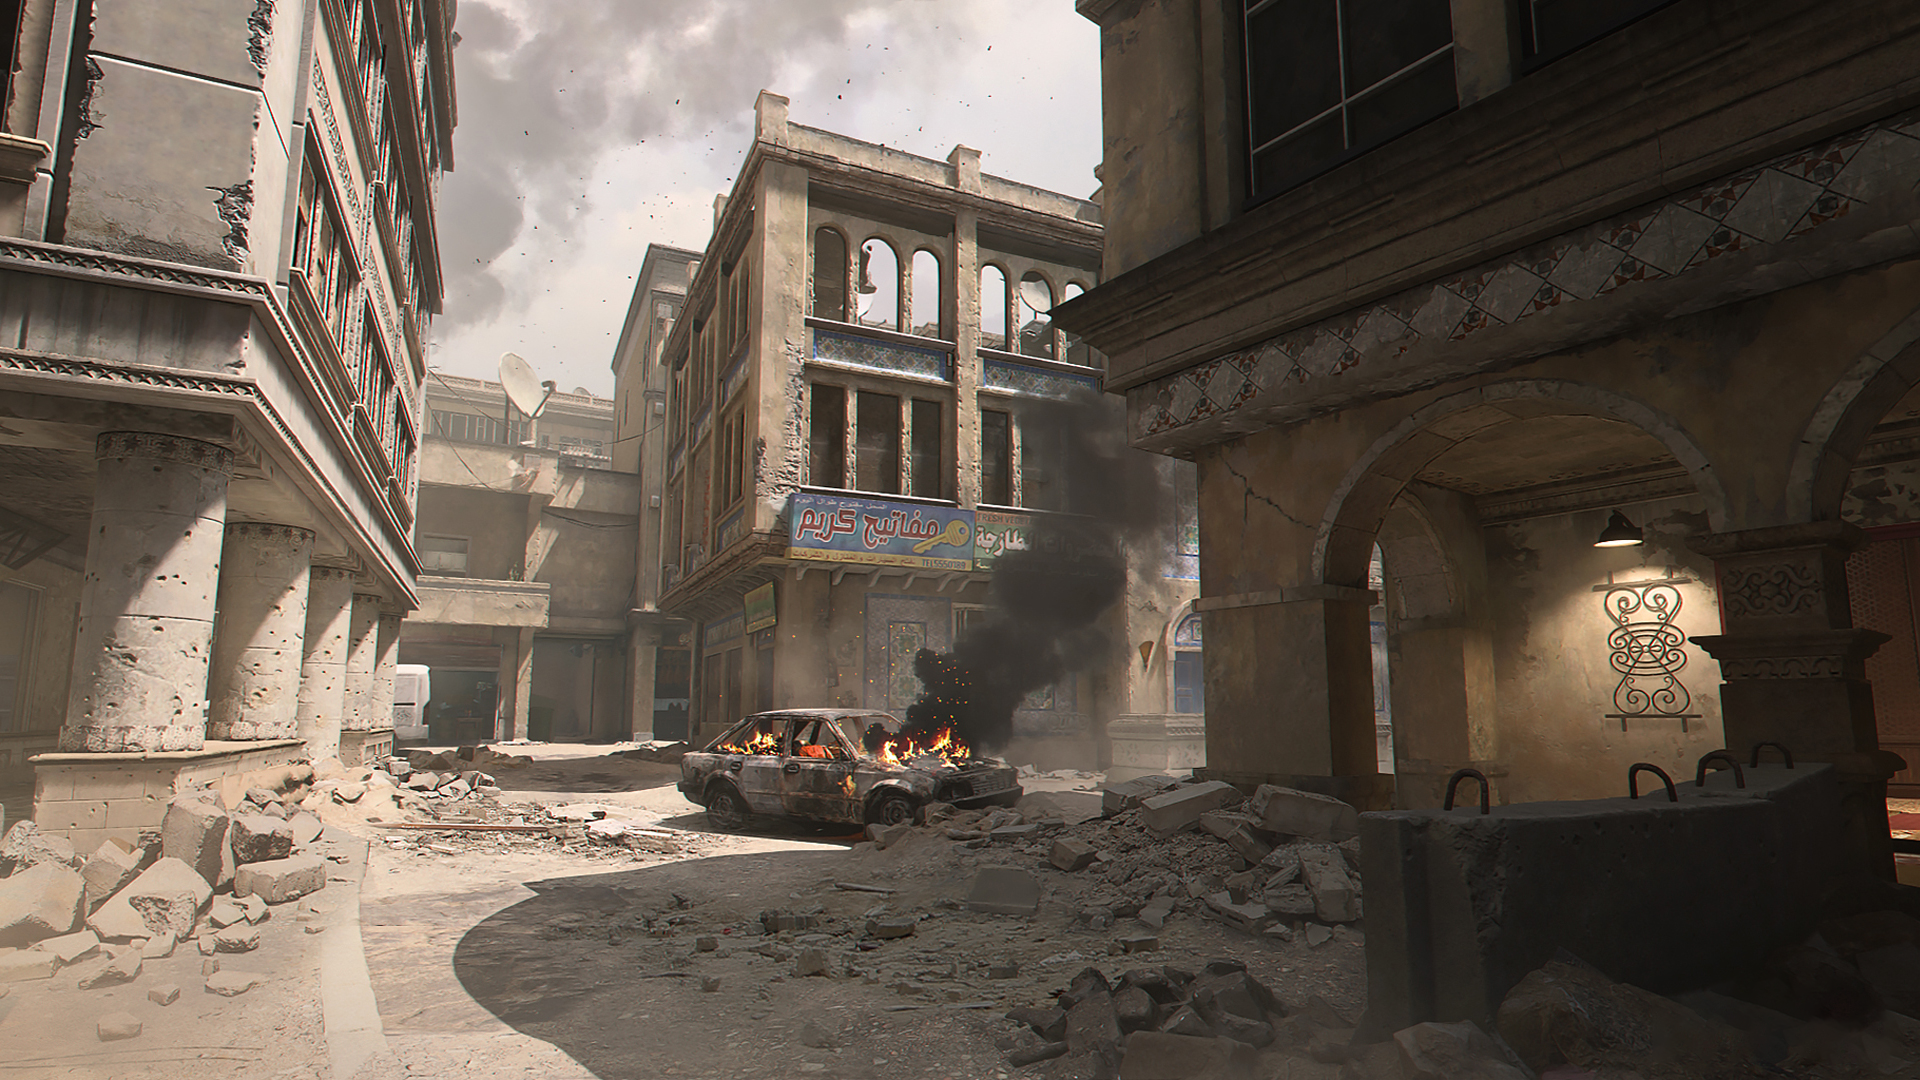 Invasion
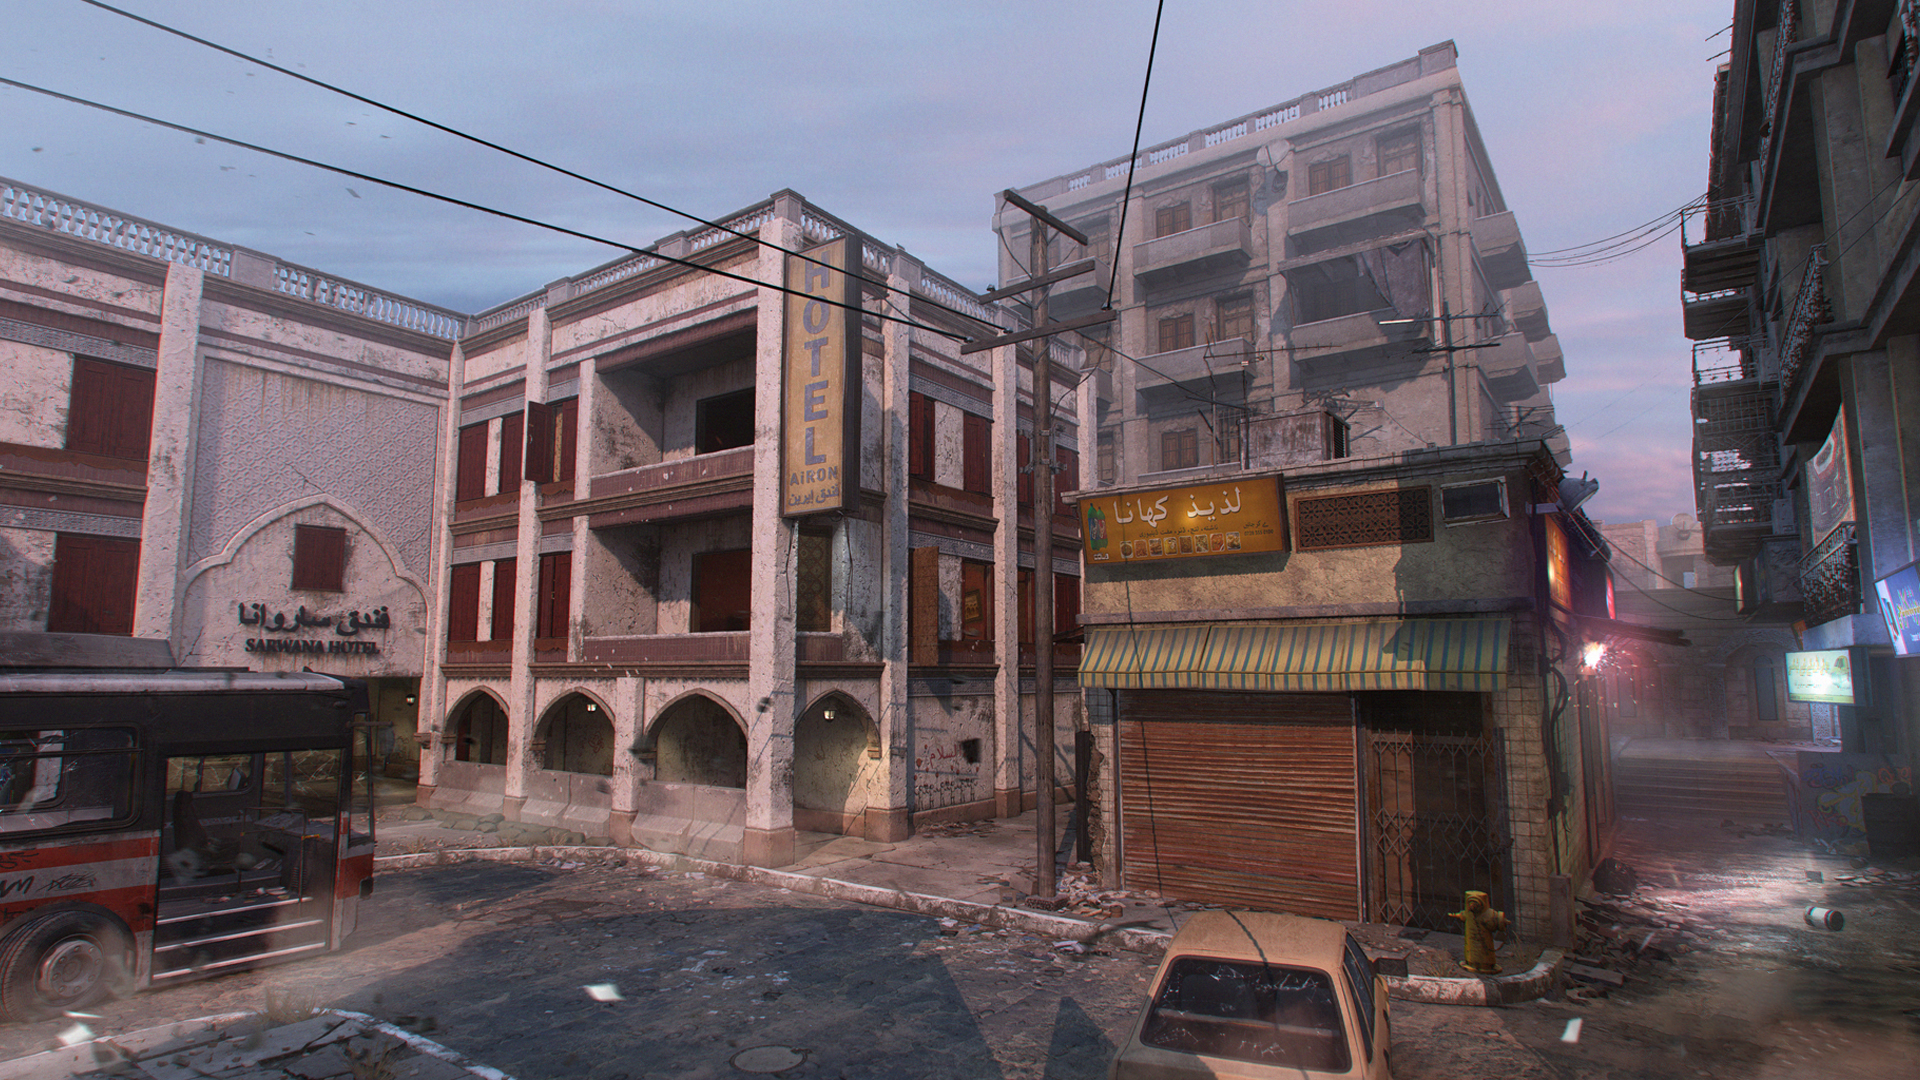 Karachi
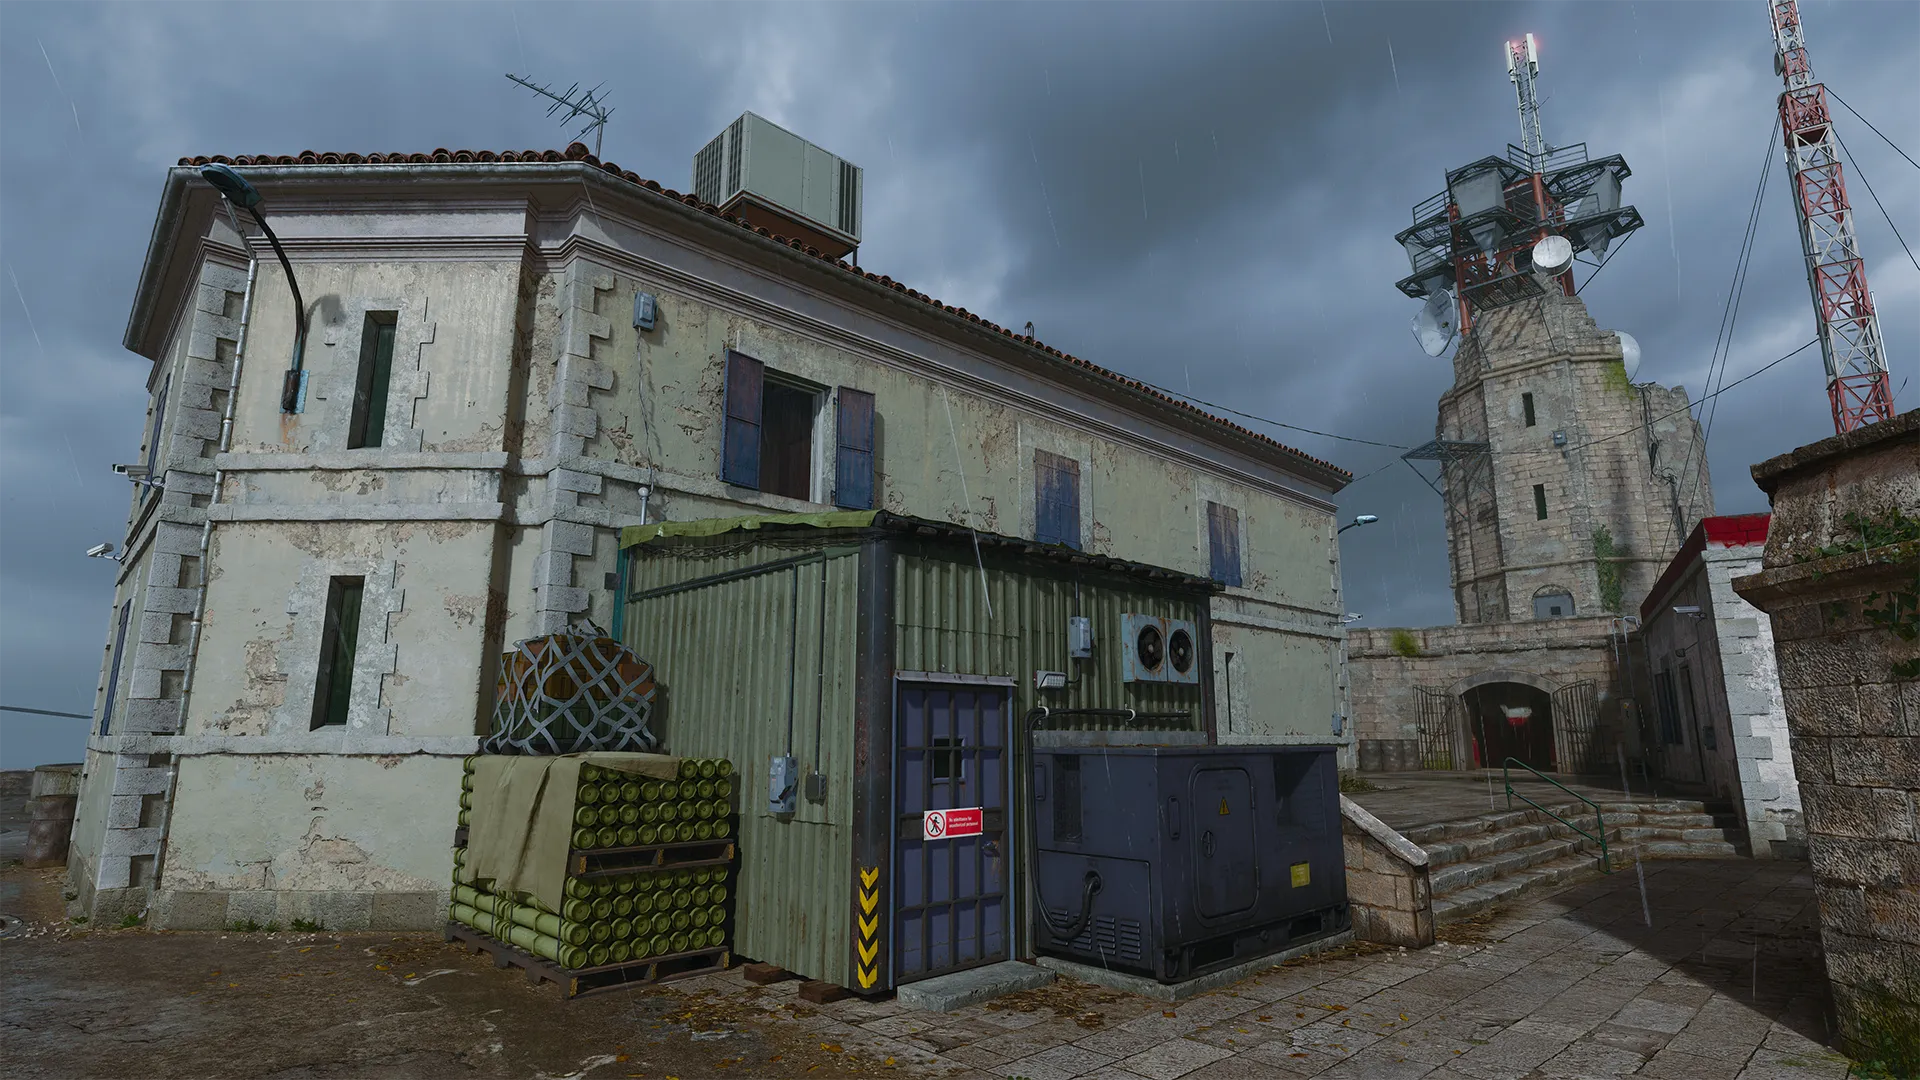 Protocol
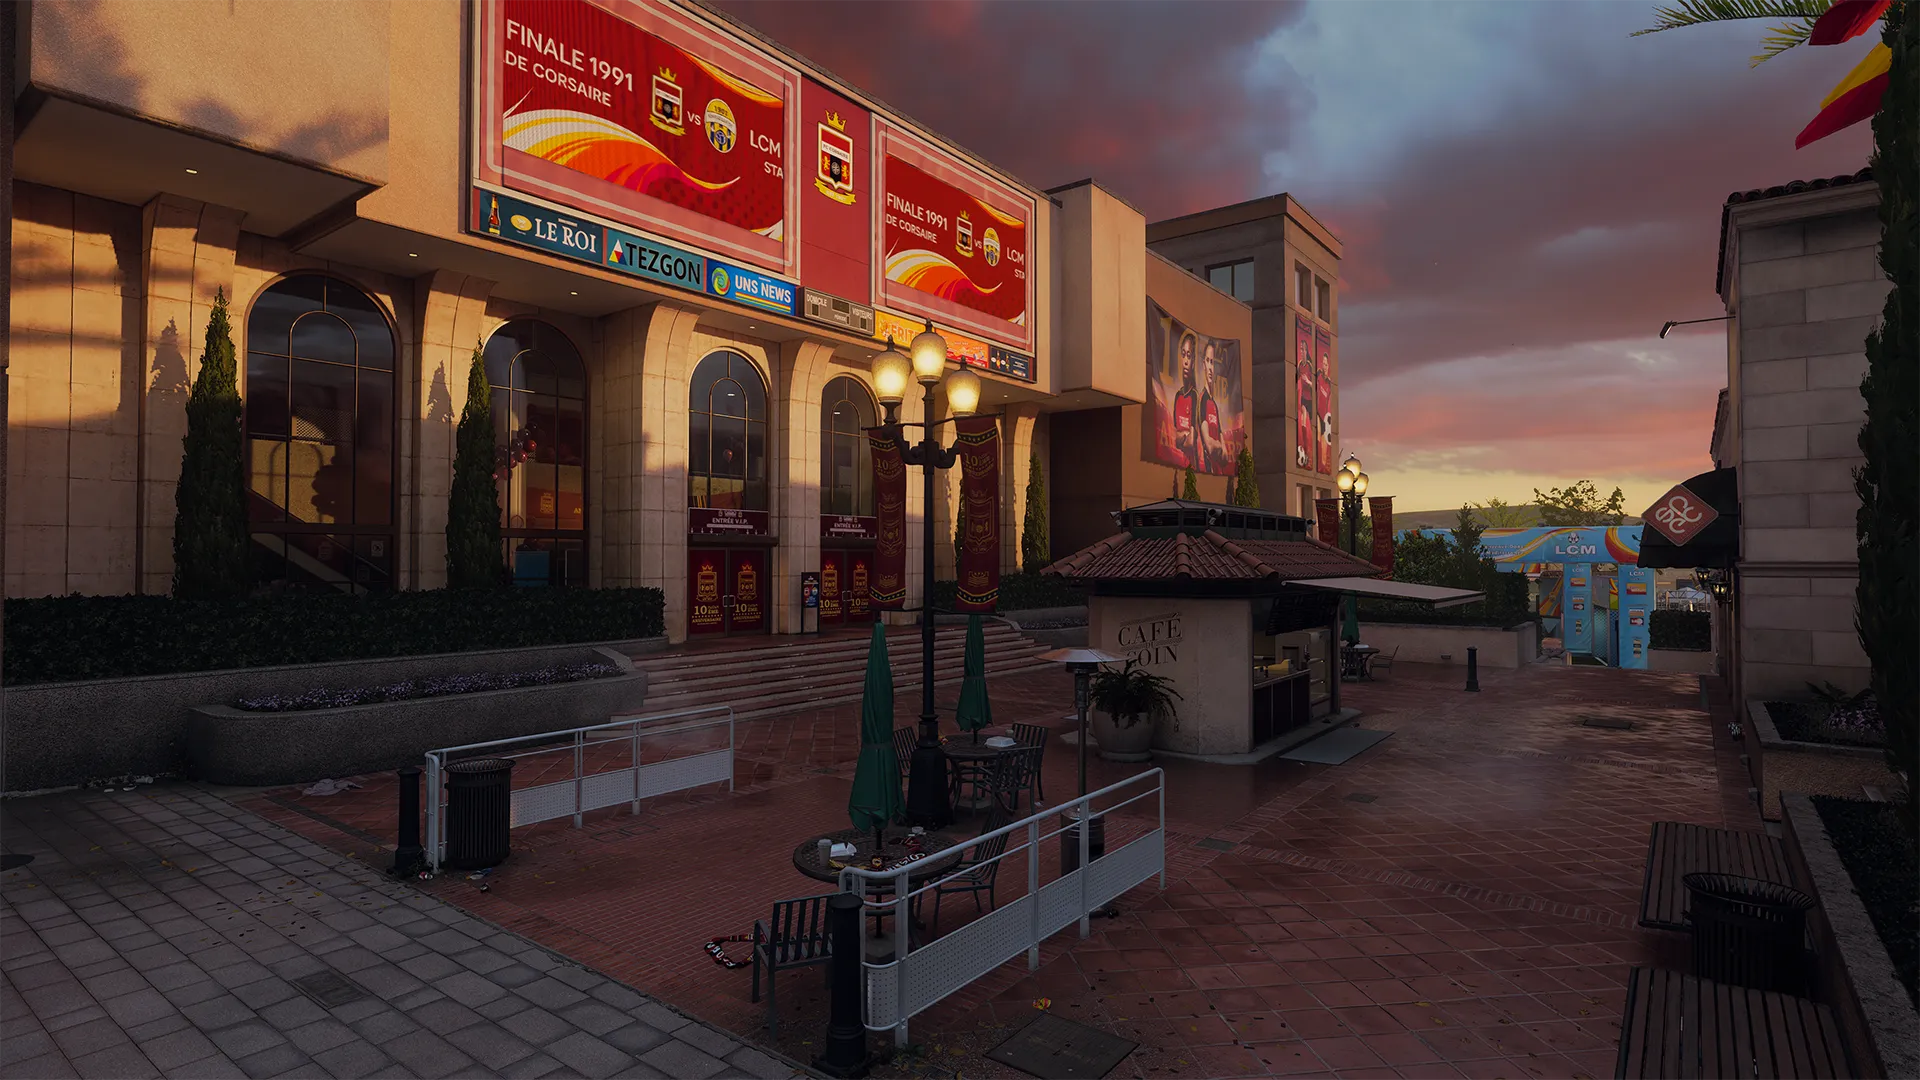 Red Card
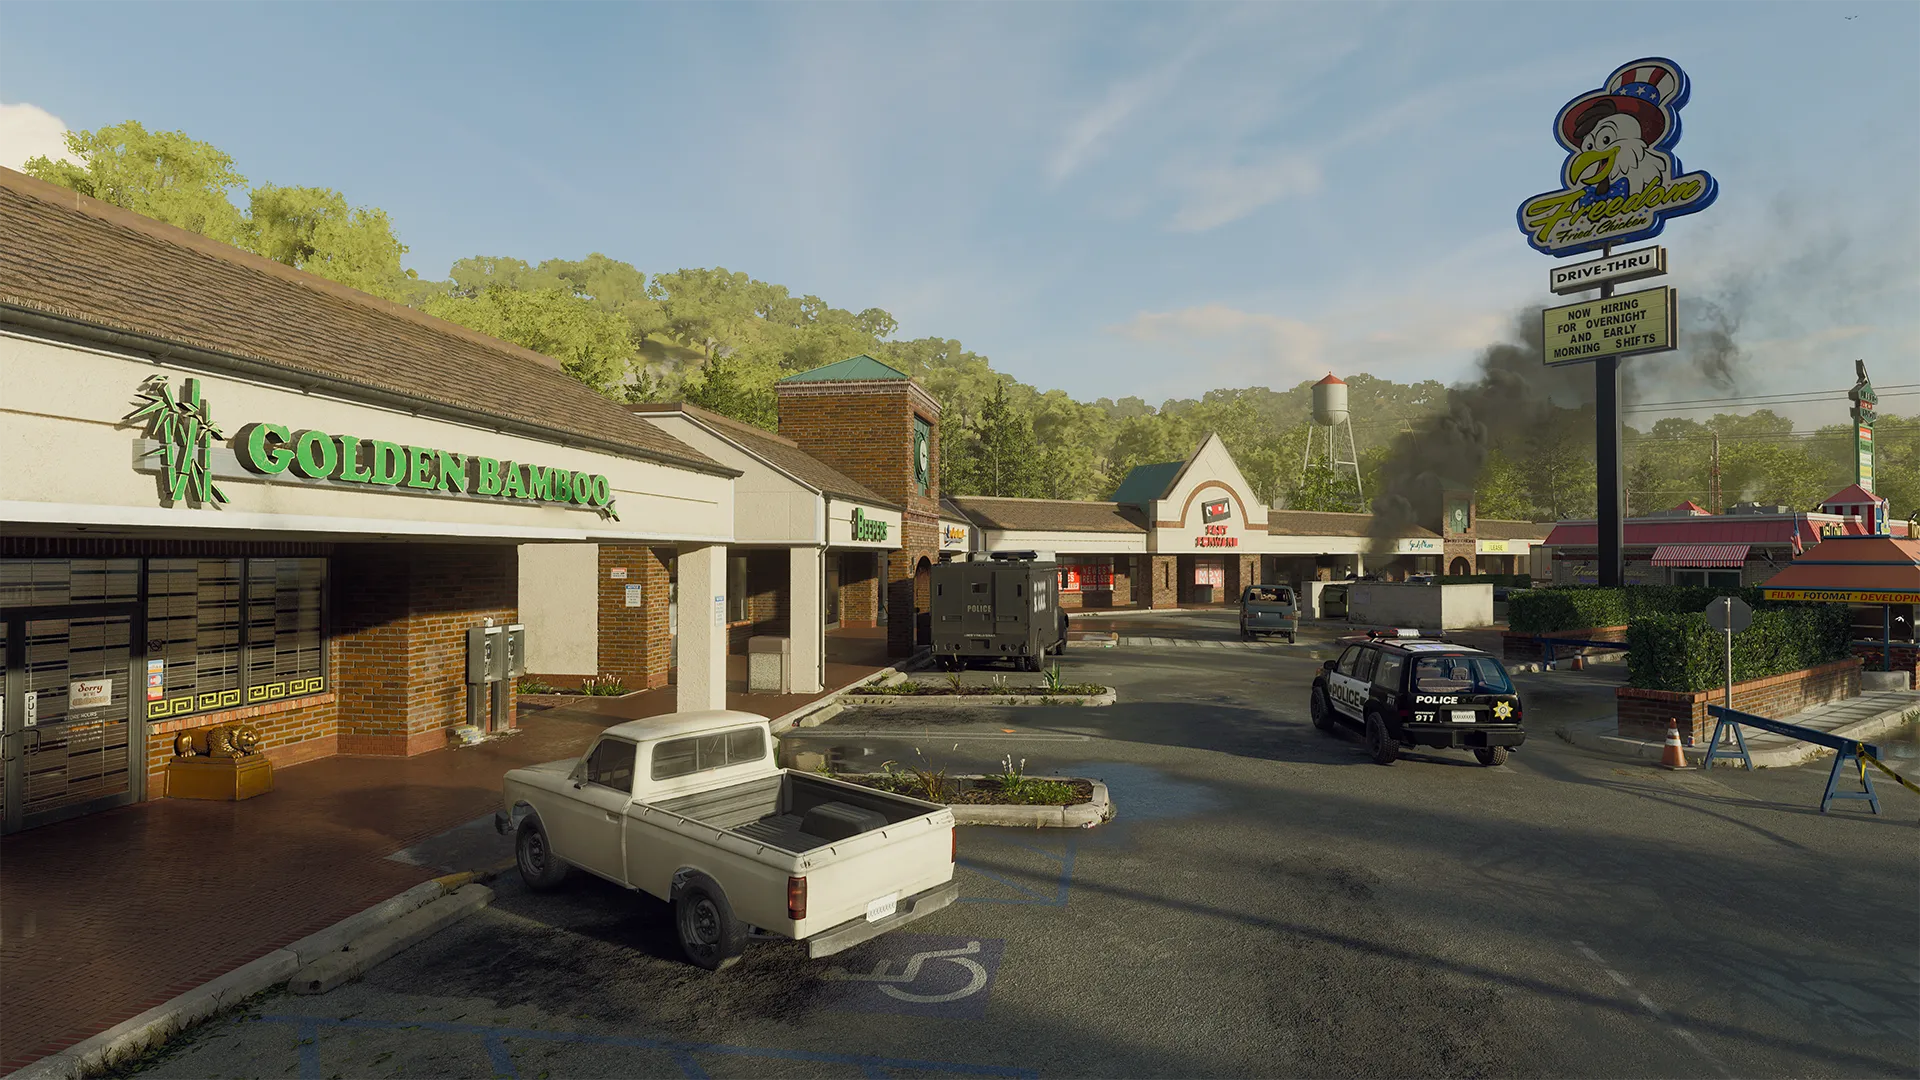 Rewind
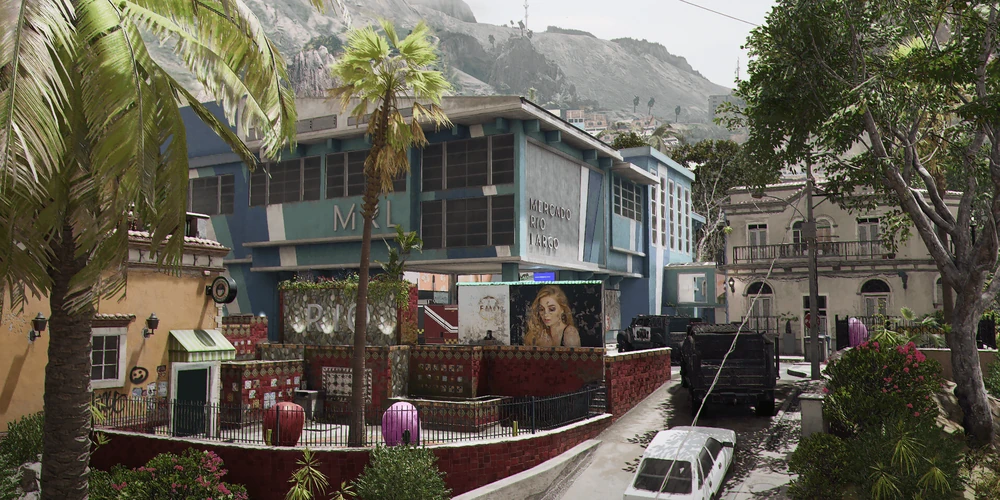 Rio
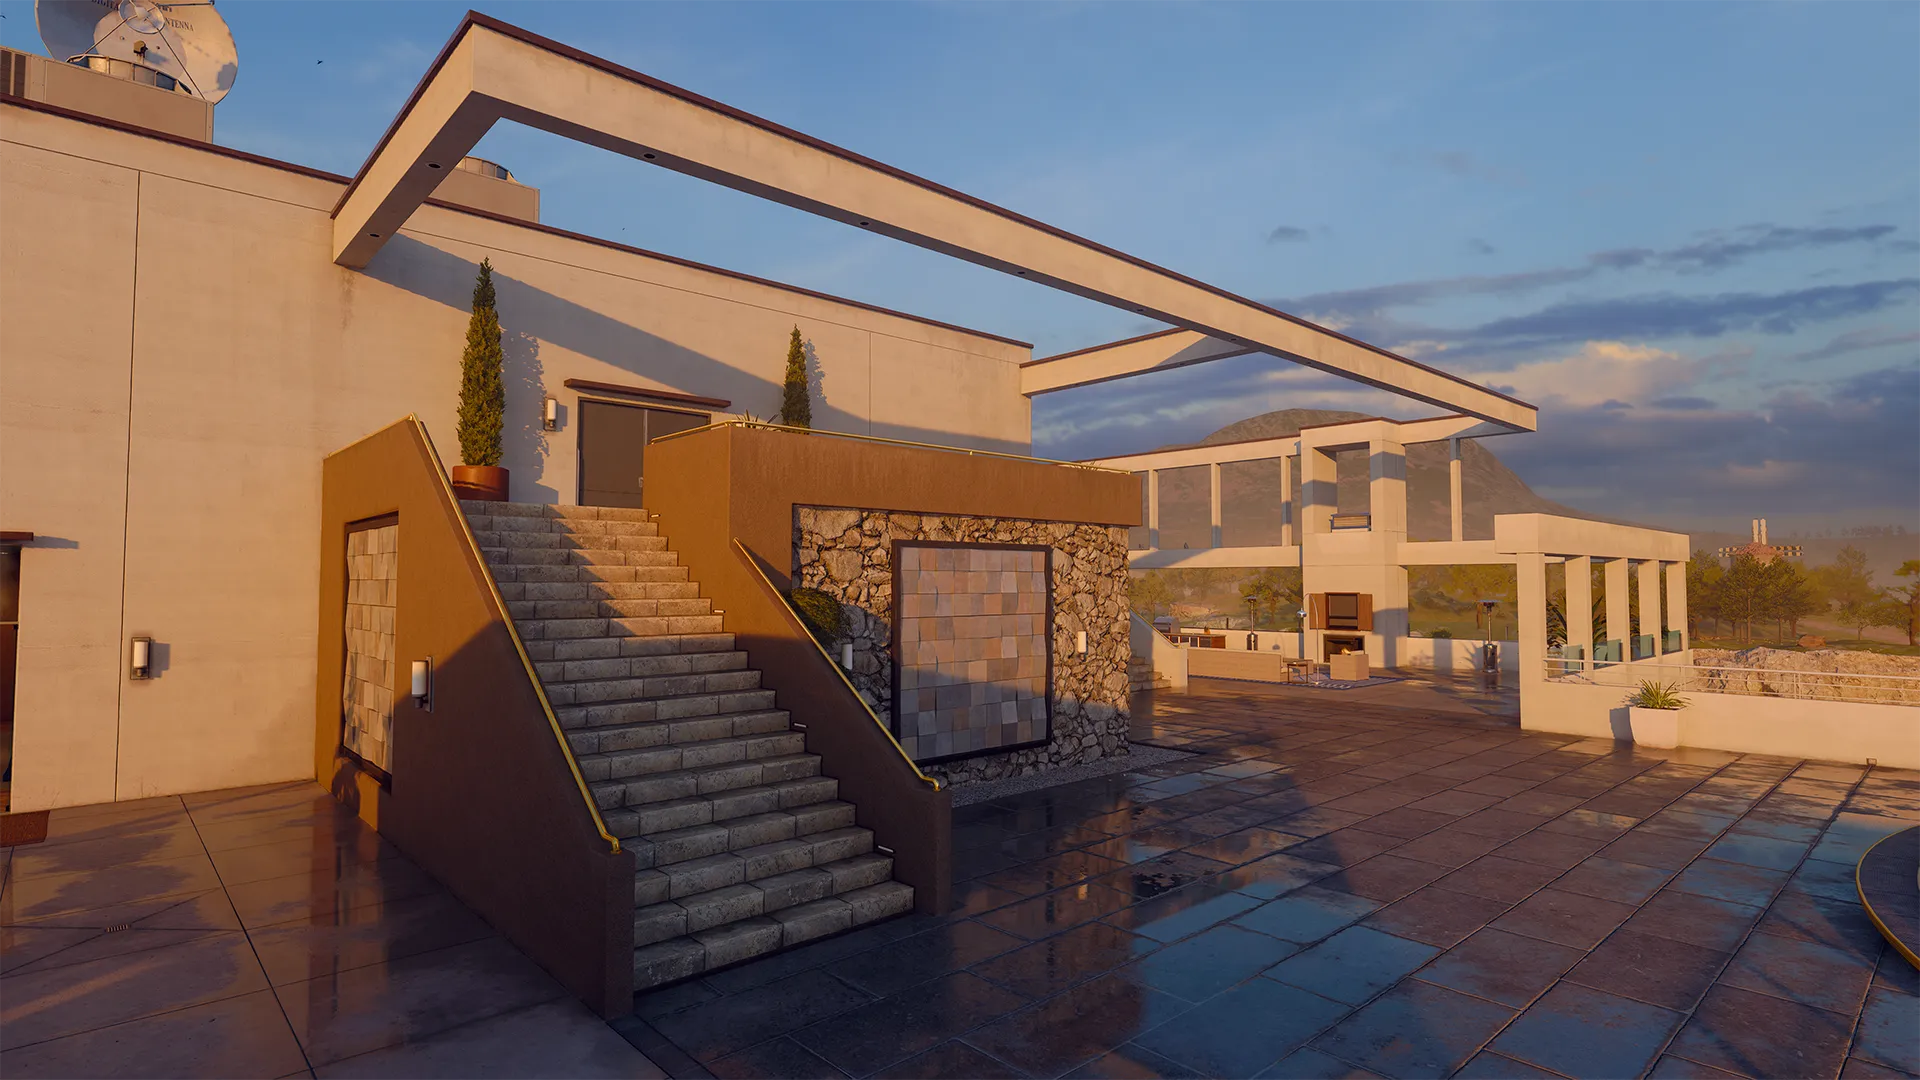 Skyline
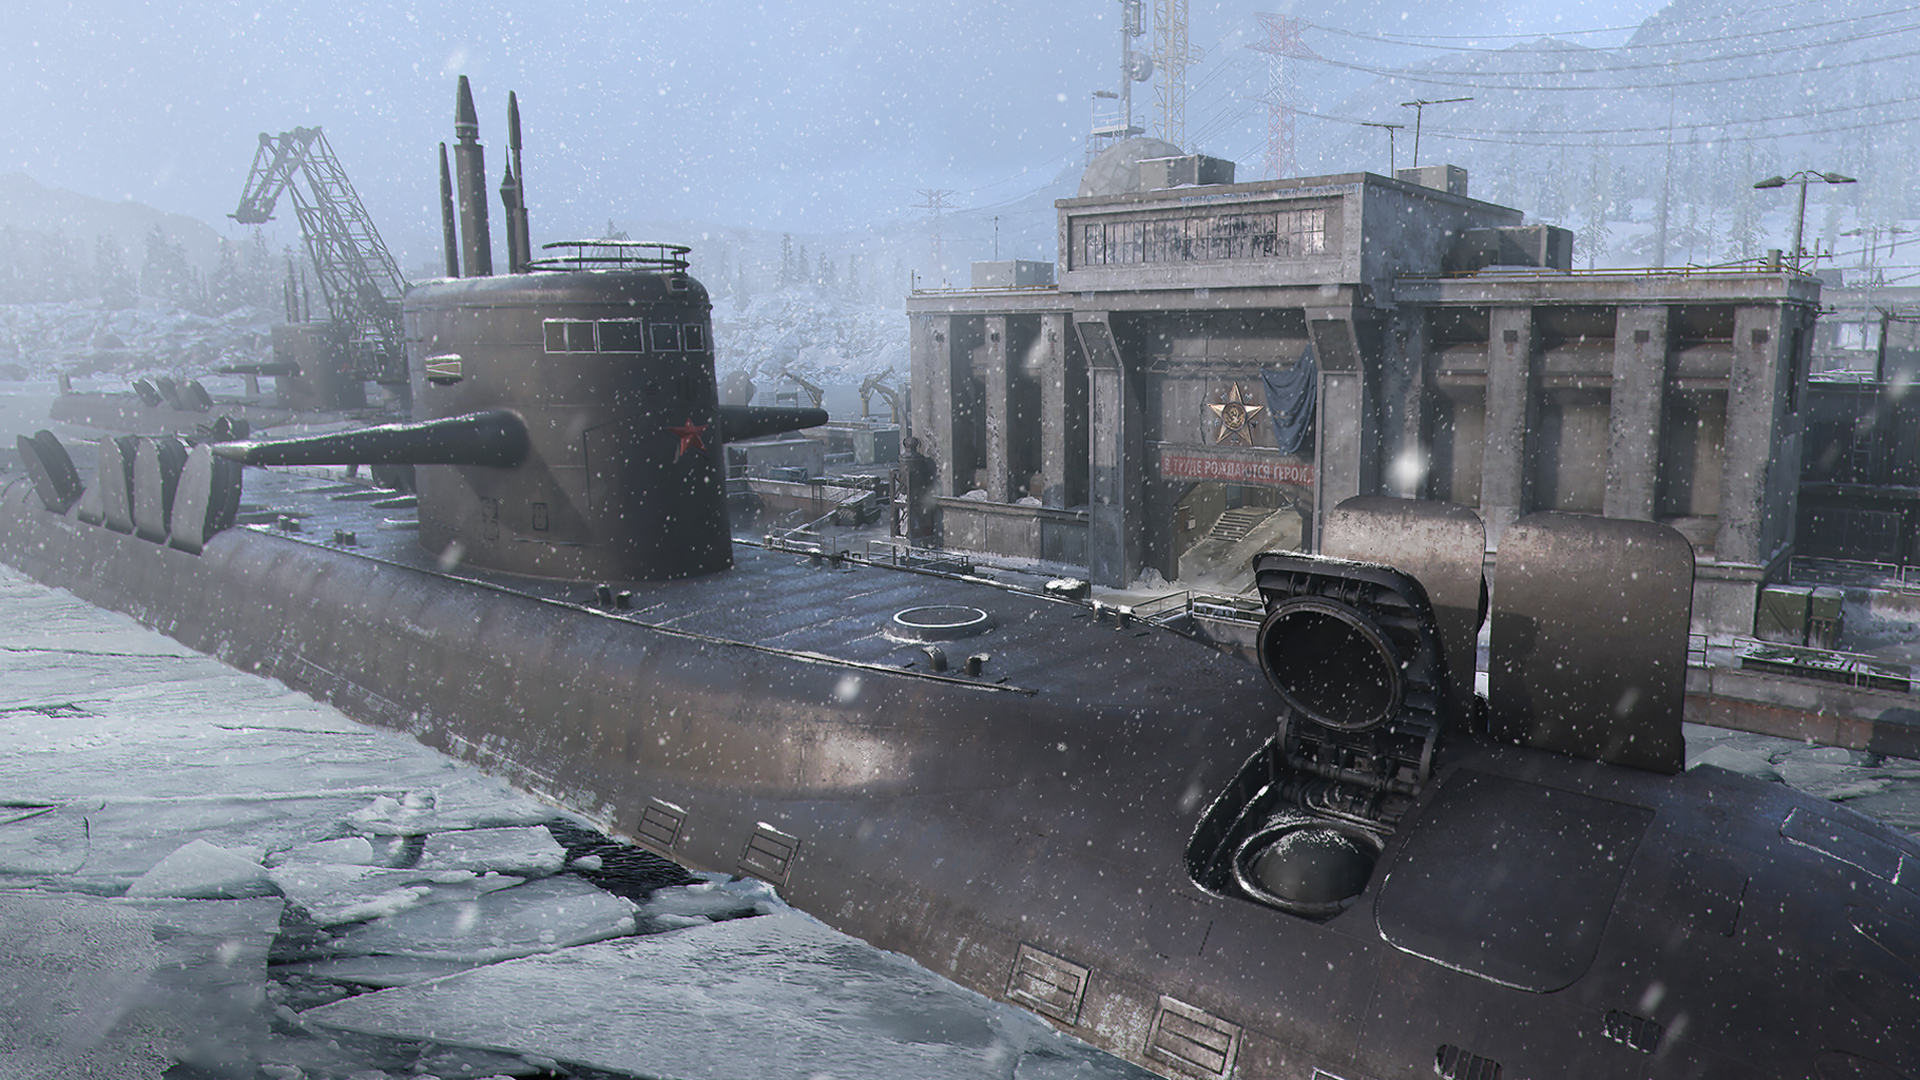 Sub Base
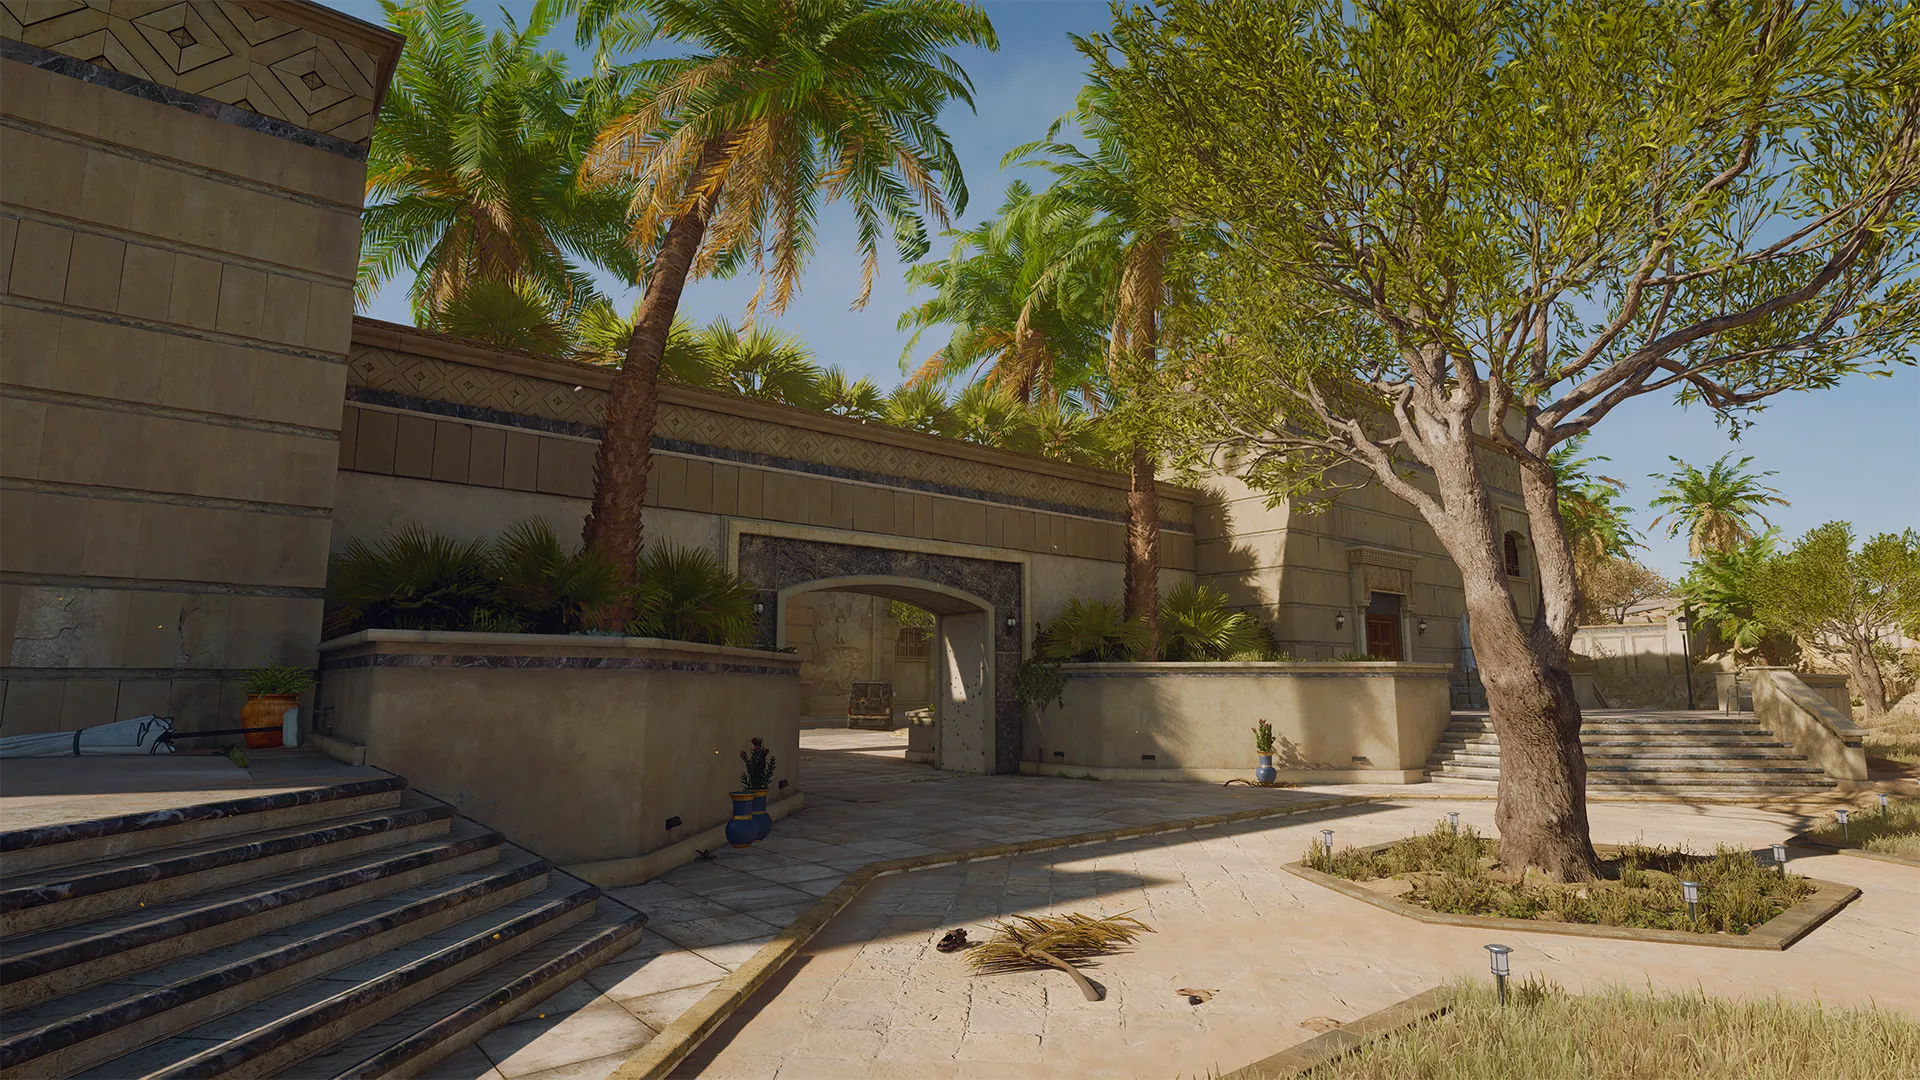 Vault
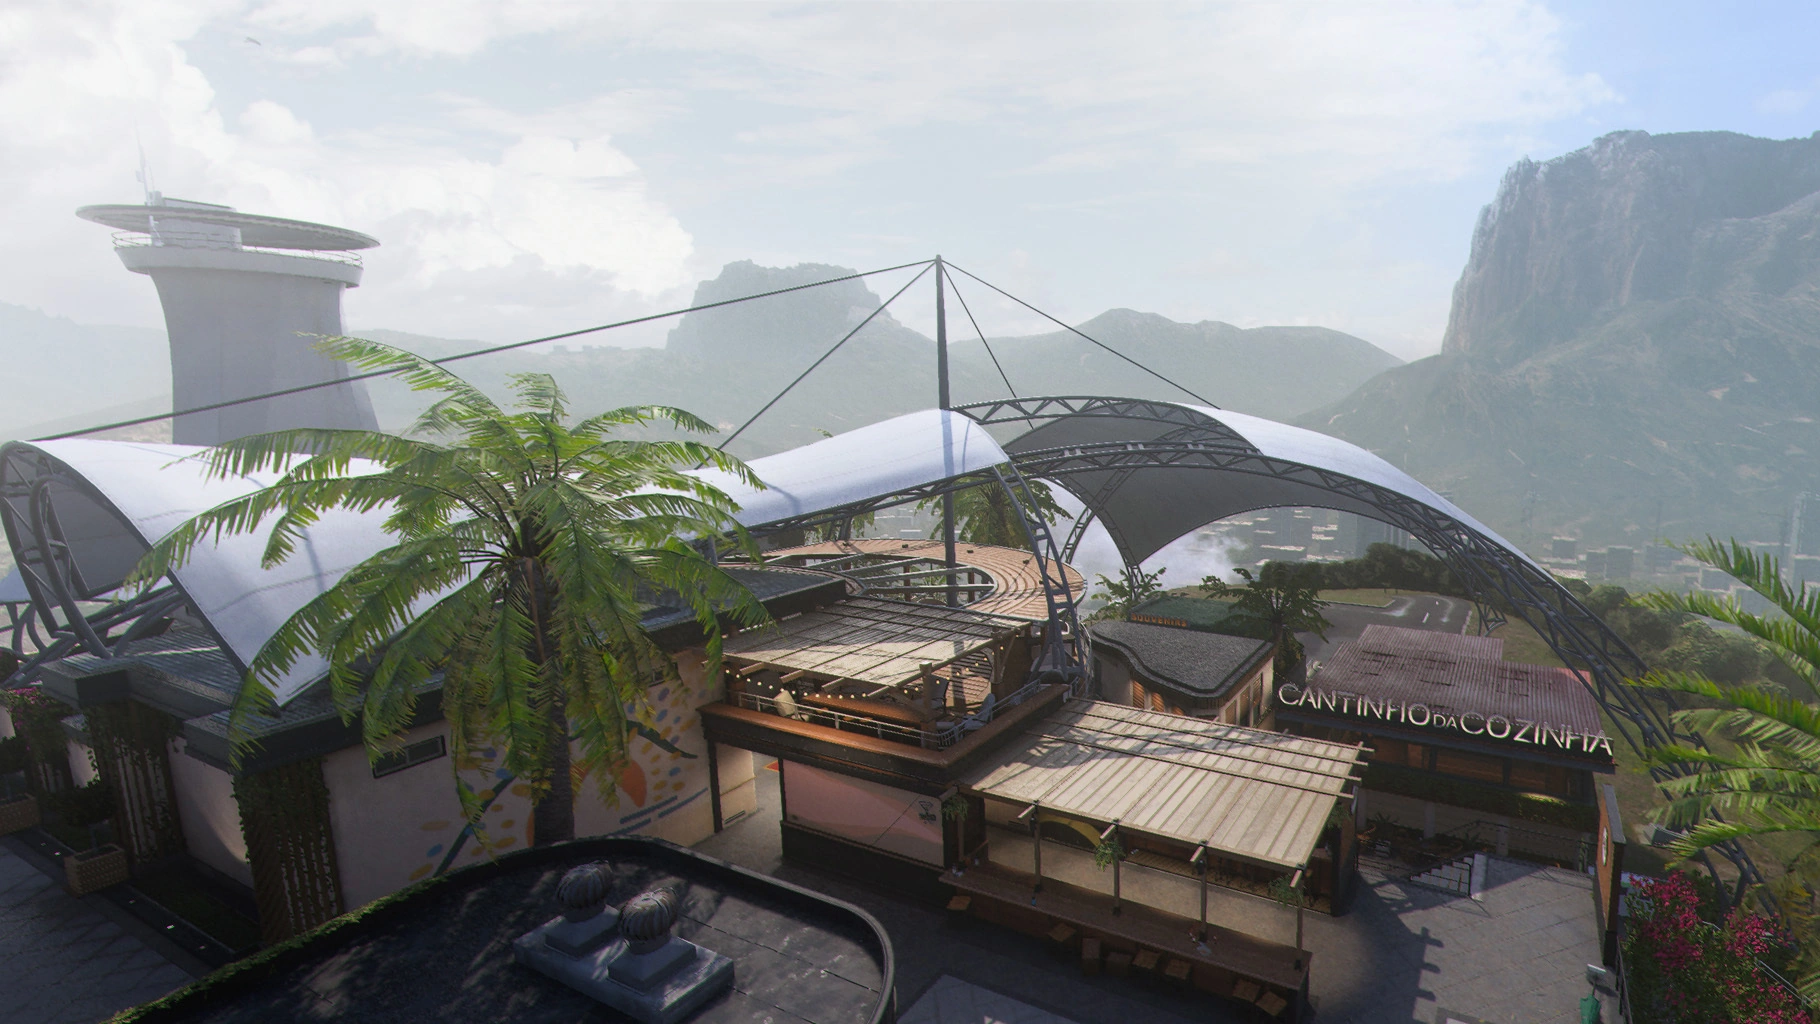 Vista
Den
HPS&DOVL
299 maps played32% of the poolBest team OpTic Texas (79%)Best player JoeDeceives
Hardpoint118 played
Best teams



Best players

Search & Destroy68 played
Best teams



Best players
Overload113 played
Best teams
Best players

Scar
HPOVL
190 maps played21% of the poolBest team Los Angeles Thieves (75%)Best player JoeDeceives
Hardpoint97 played
Best teams

Best players


Overload93 played
Best teams
Best players

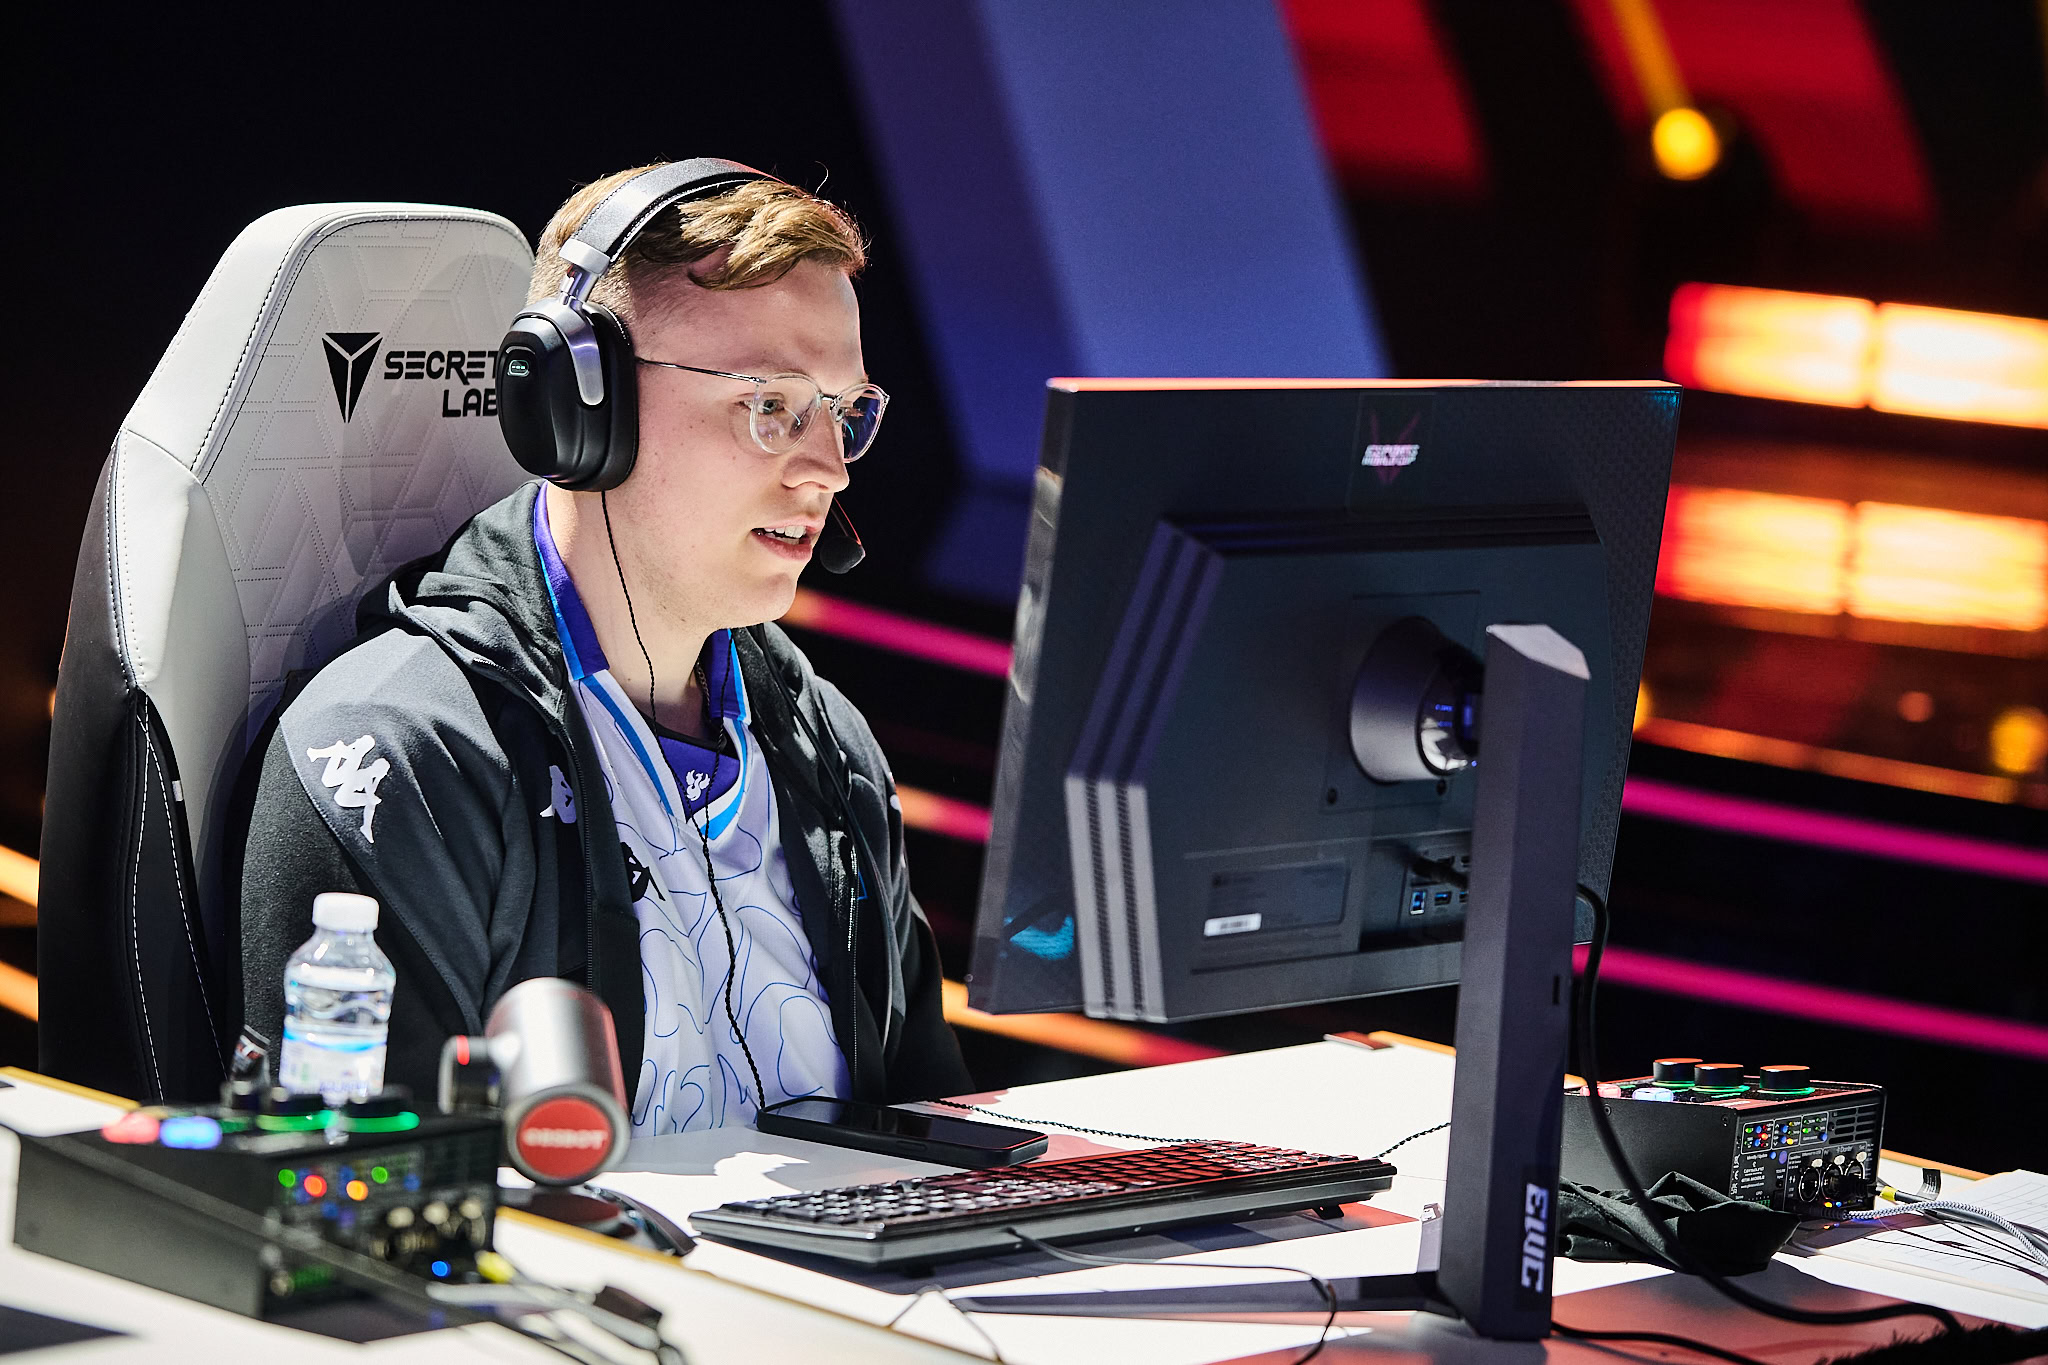
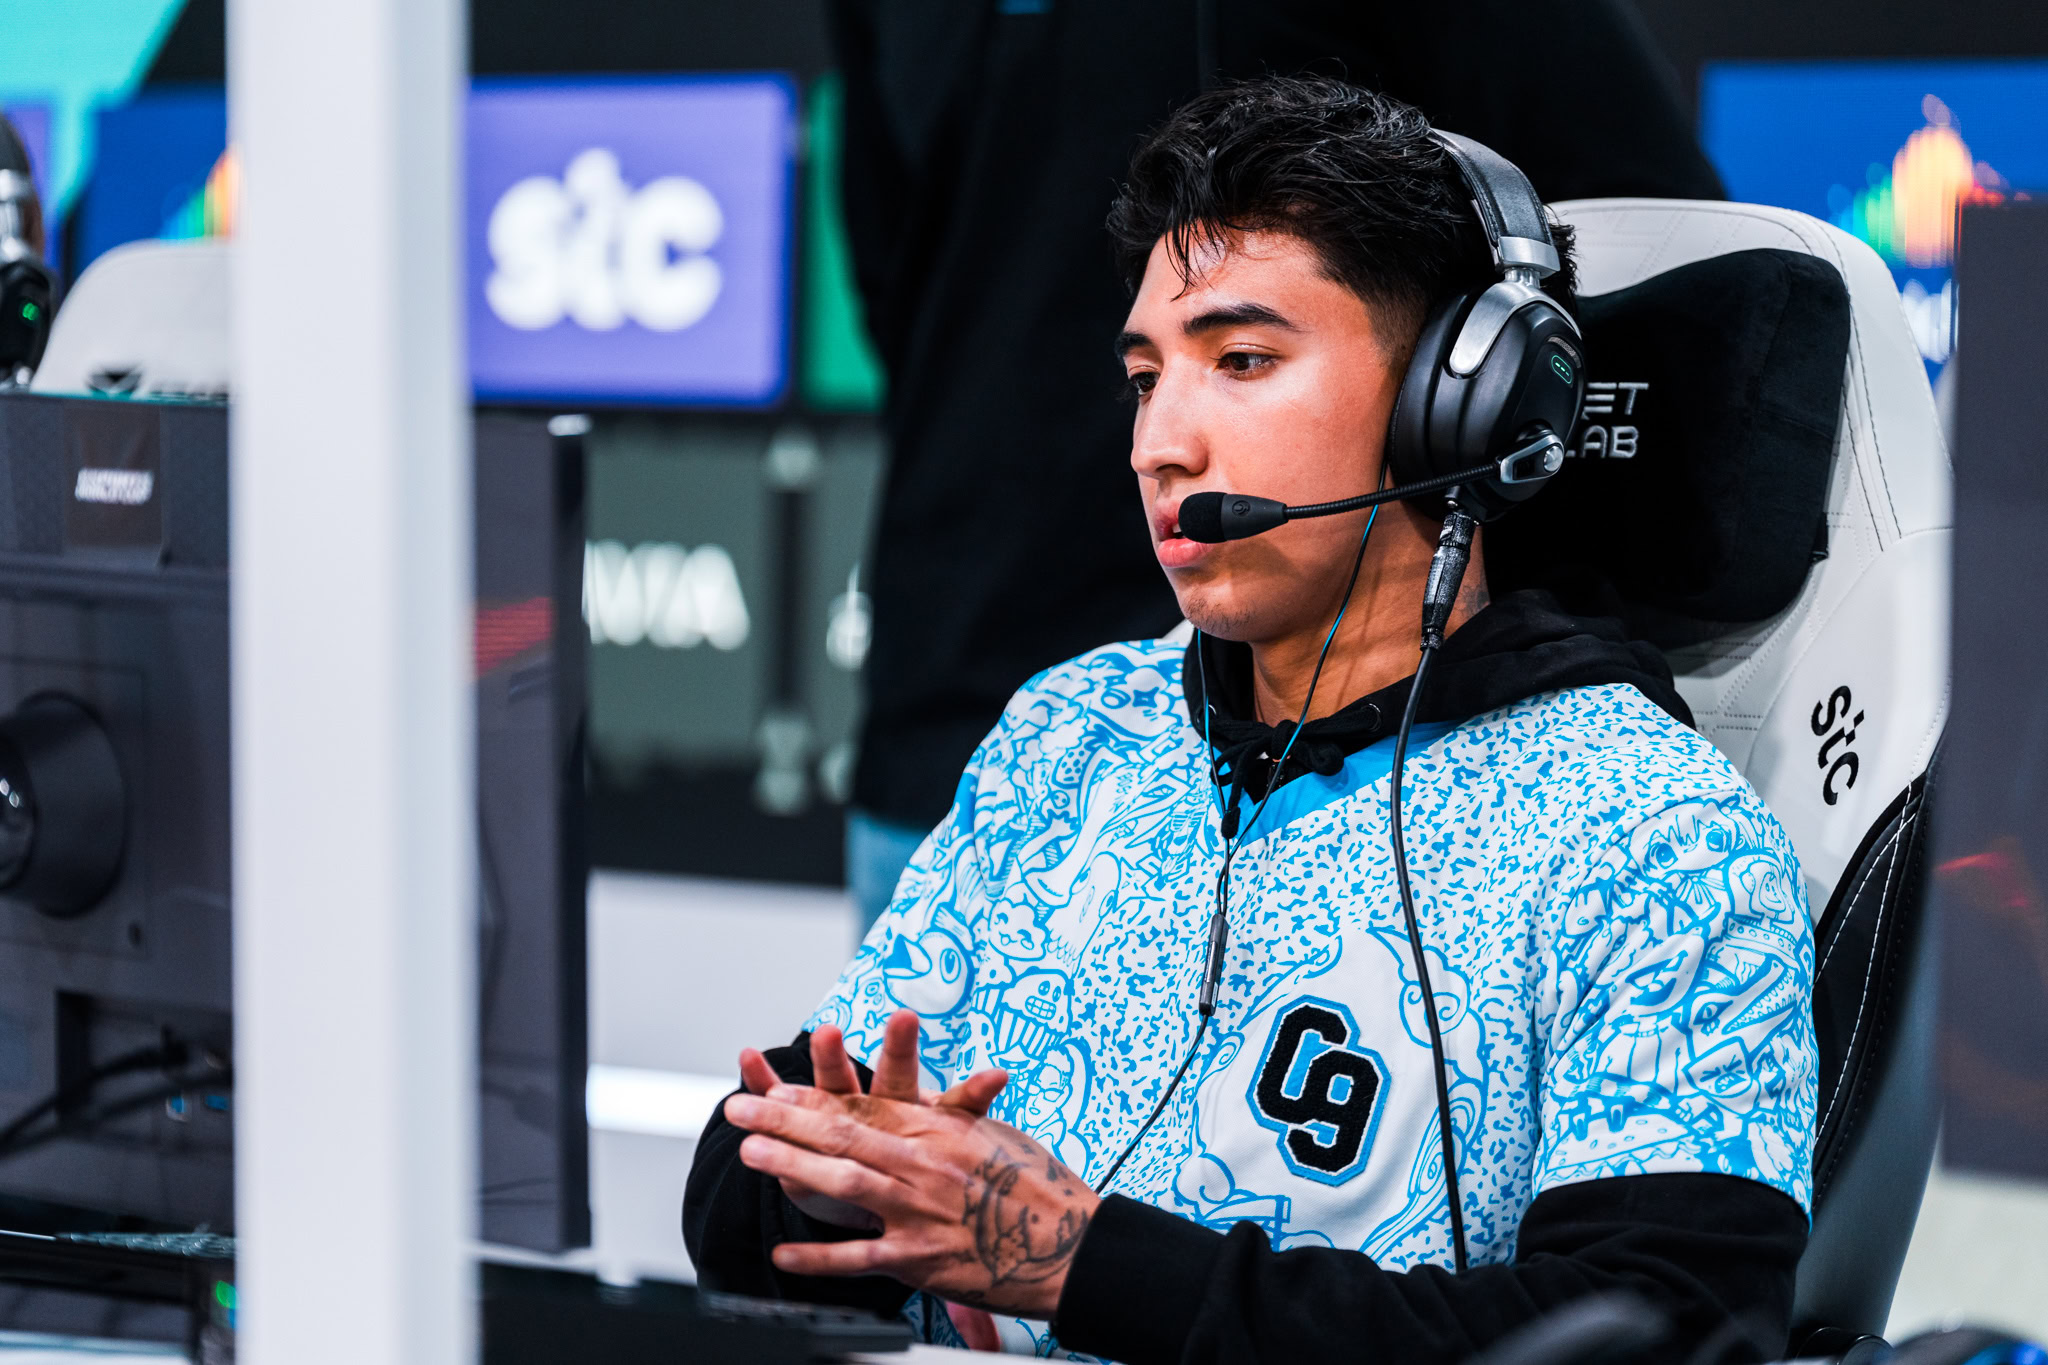
Colossus
HP
93 maps played10% of the poolBest team OpTic Texas (80%)Best player JoeDeceives
Hardpoint93 played
Best teams
Best players

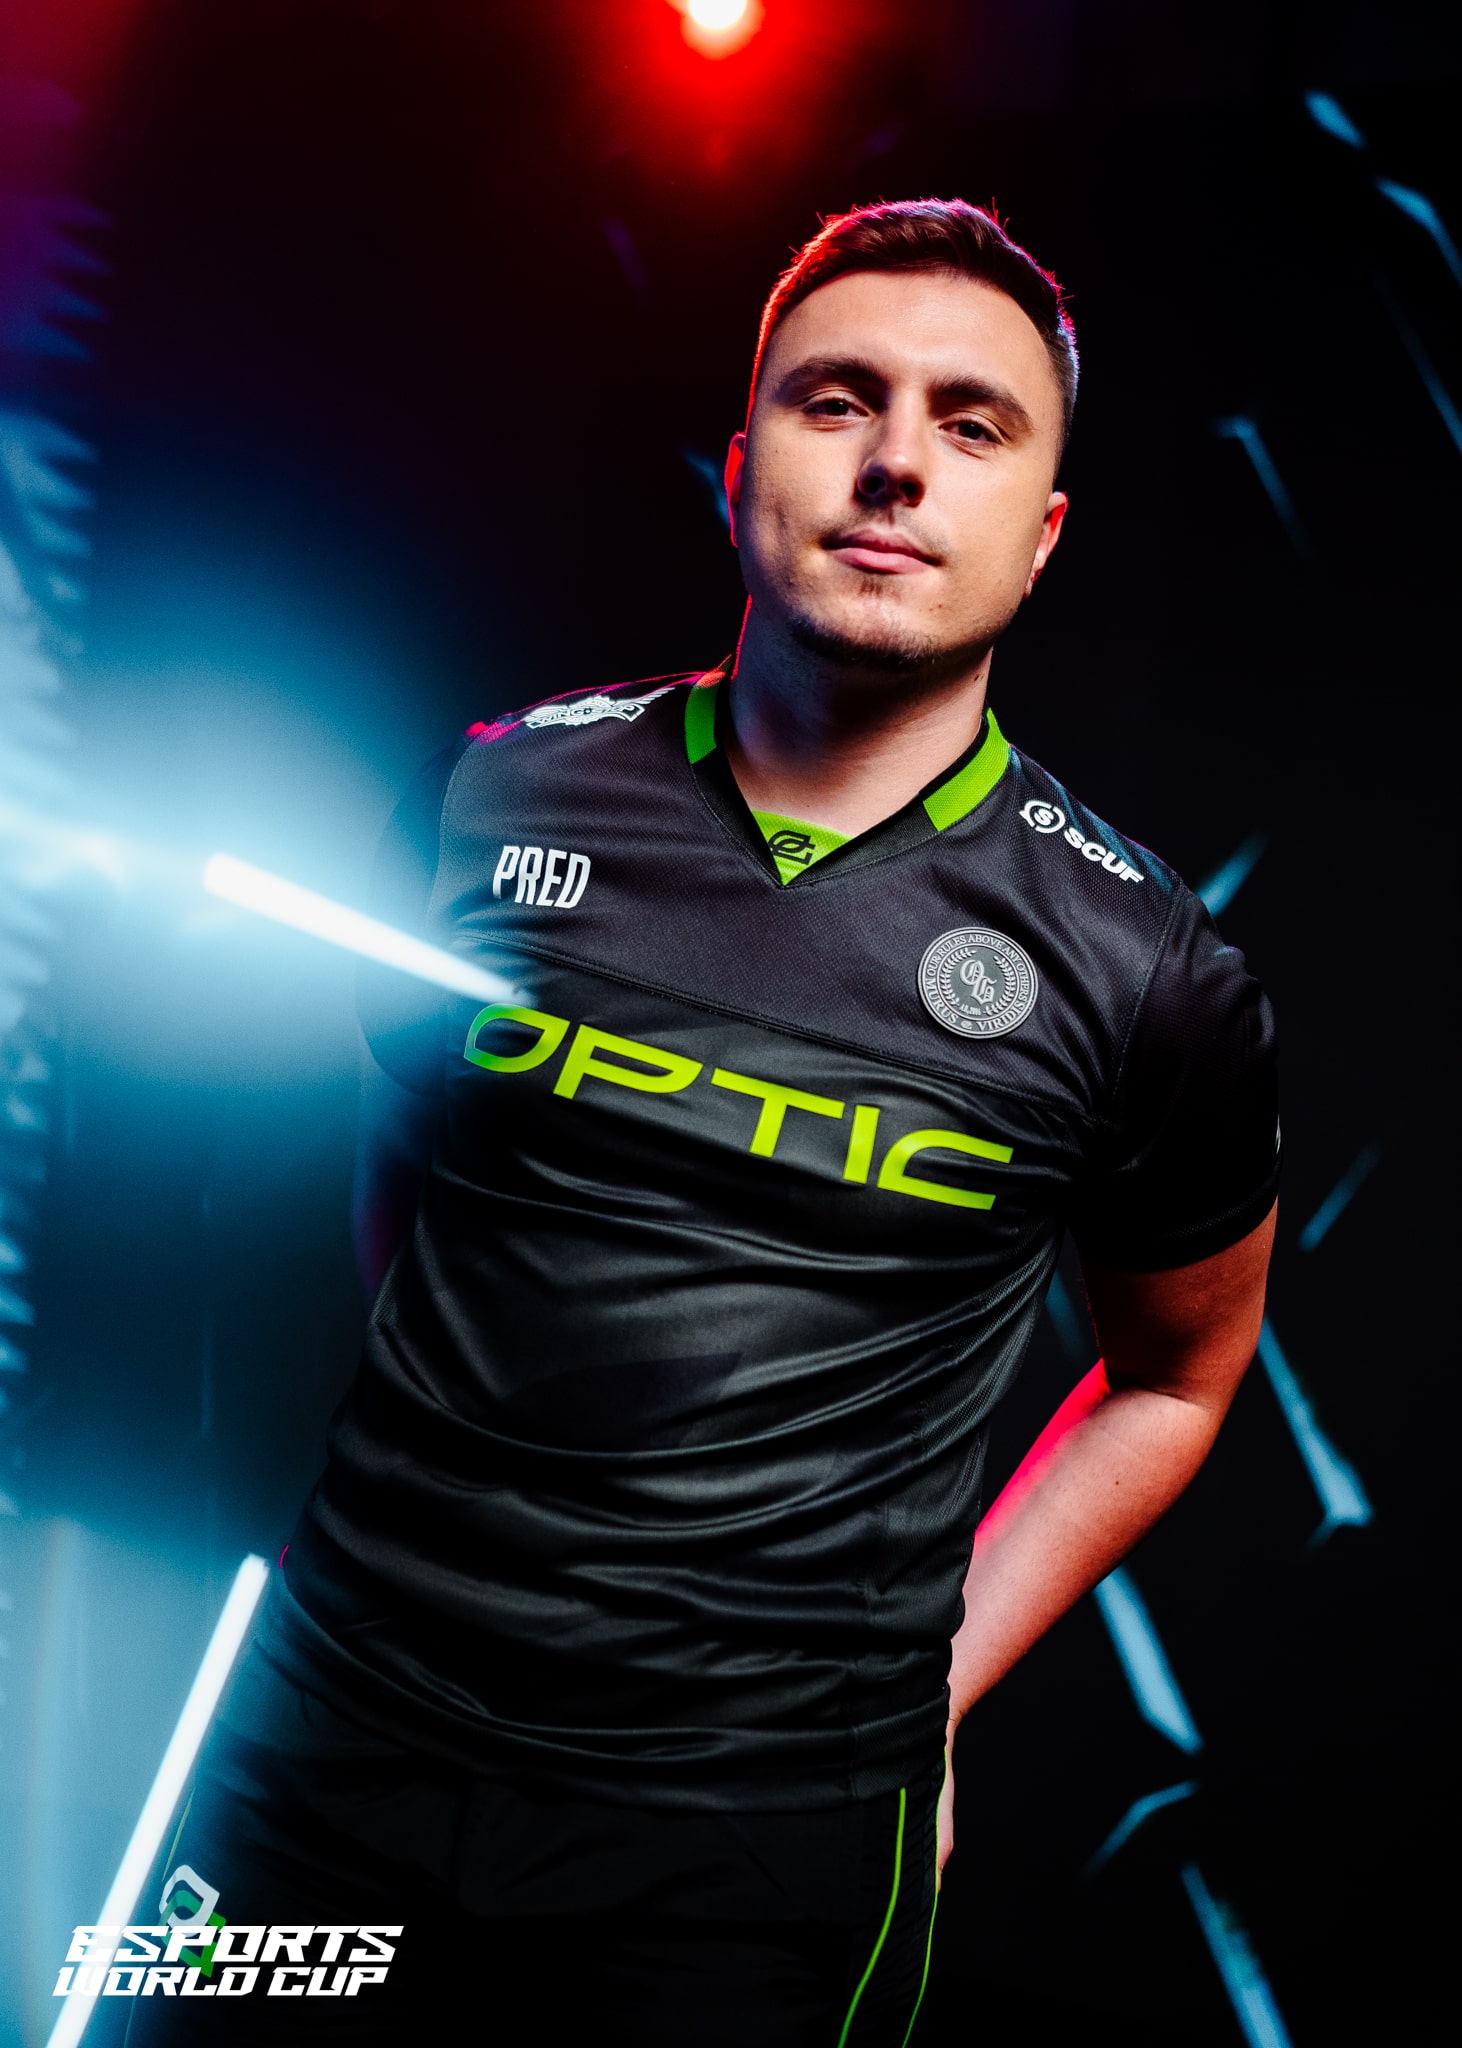
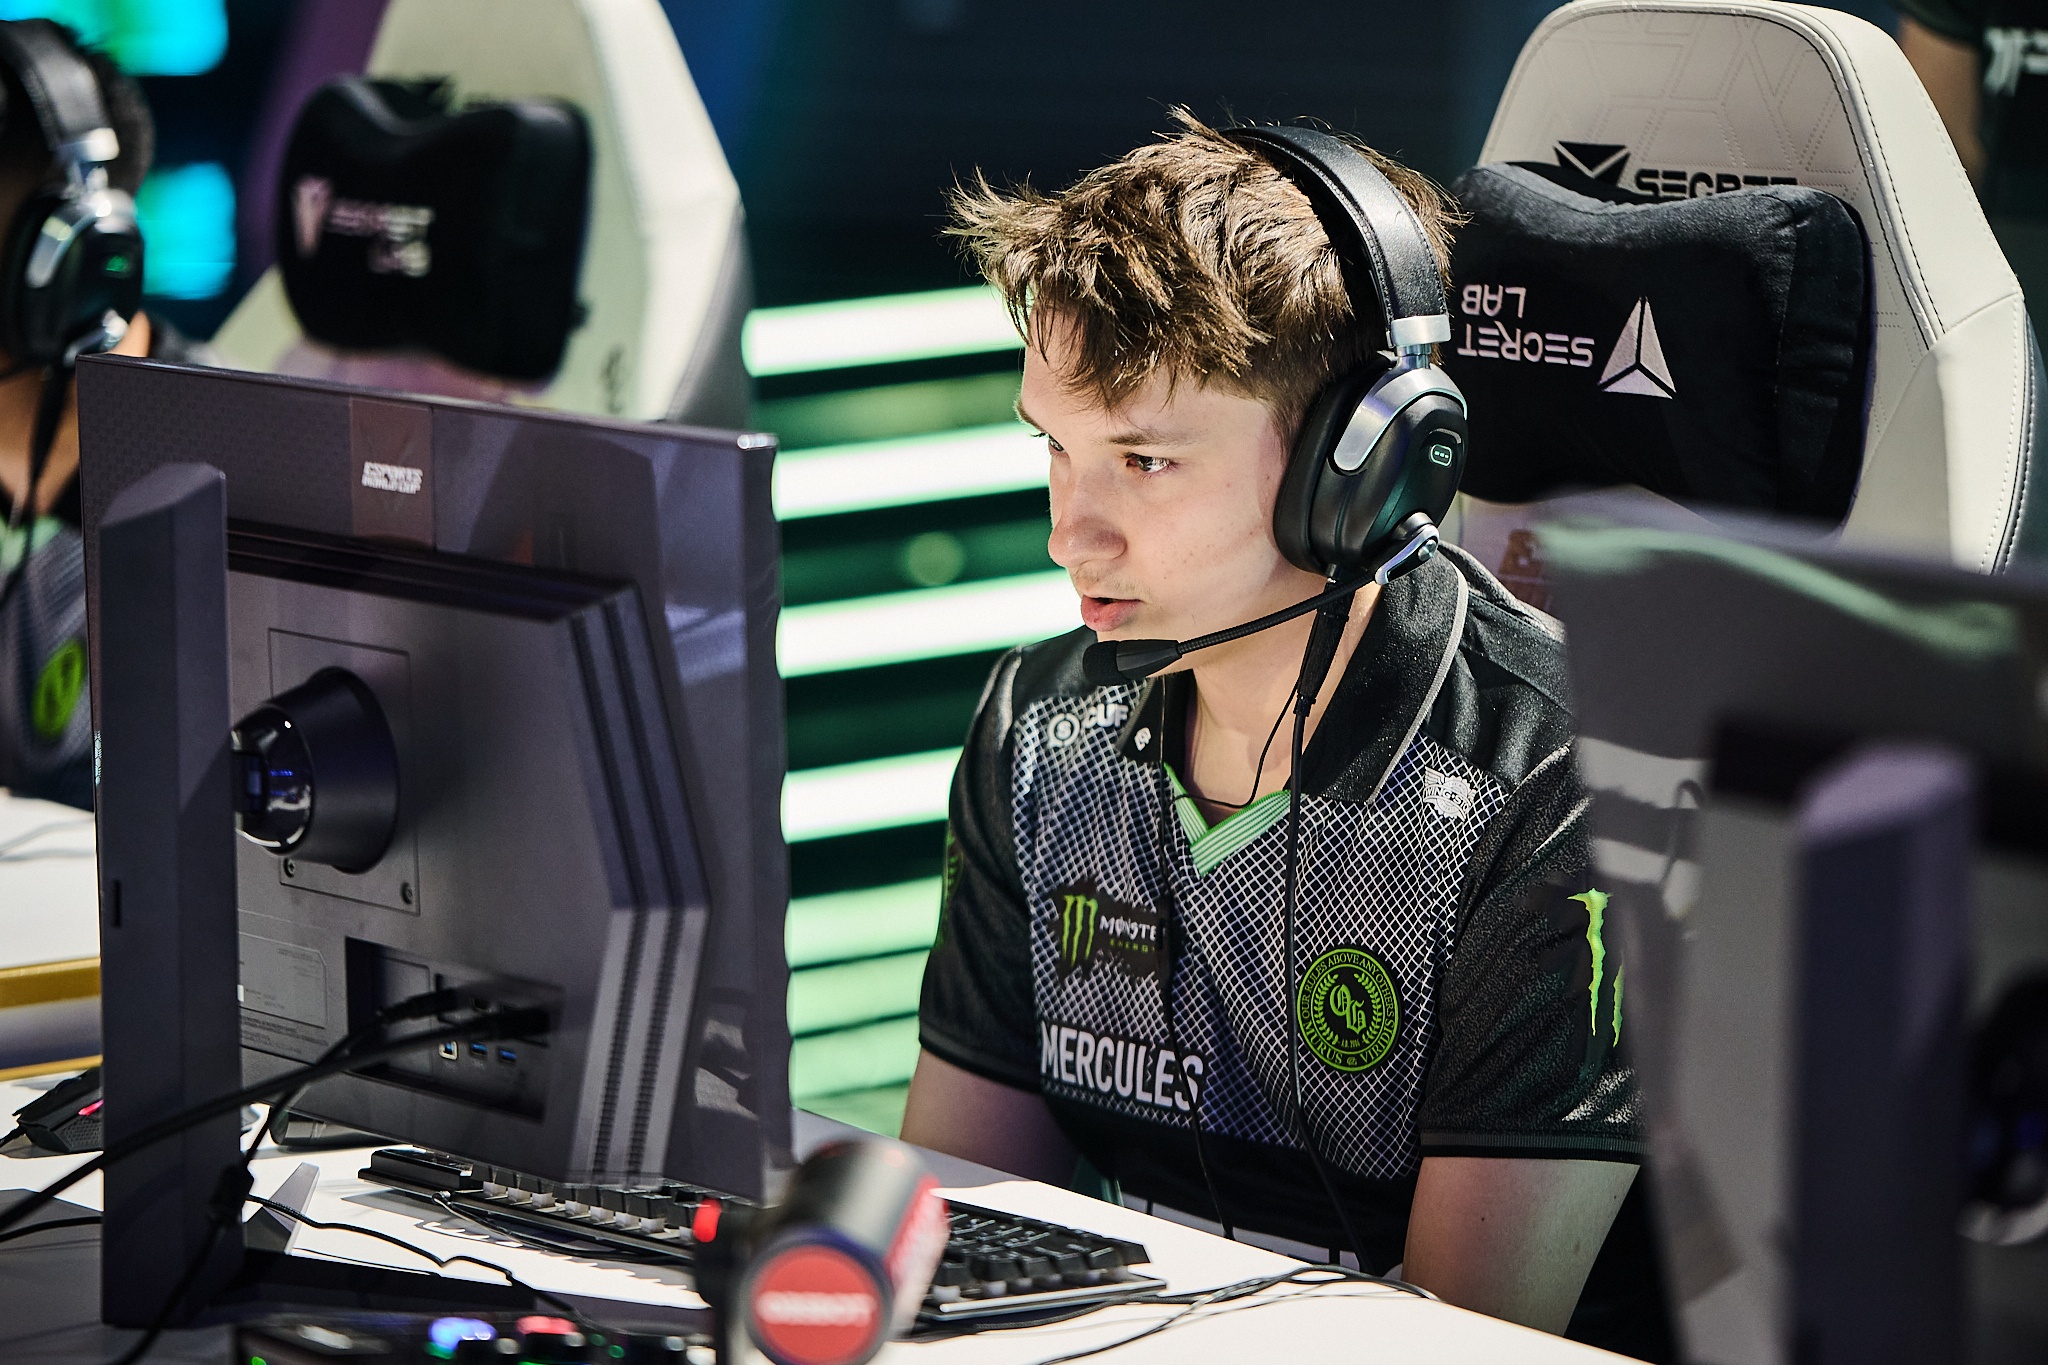
Exposure
OVL
81 maps played9% of the poolBest team OpTic Texas (83%)Best player Estreal
Overload81 played
Best teams

Best players

Gridlock
HPS&DOVL
70 maps played8% of the poolBest team Los Angeles Thieves (88%)Best player HyDra

Sake
HPS&D
54 maps played6% of the poolBest team Los Angeles Thieves (91%)Best player JoeDeceives
Hardpoint48 played
Best teams
Best players
Search & Destroy6 played
Best teams
Best players
No player is above average here yet.
Fringe
S&D
37 maps played4% of the poolBest team Miami Heretics (64%)Best player KiSMET
Search & Destroy37 played
Best teams
Best players
Hacienda
HPS&DCTRL
218 maps played24% of the poolBest team Los Angeles Thieves (72%)Best player Snoopy
Hardpoint84 played
Best teams

 Atlanta FaZe11–1052%32–72
Best players
Search & Destroy54 played
Best teams
 Minnesota RØKKR5–271%36–92
Best players
Control79 played
Best teams
Atlanta FaZe15–768%47–84
Best players
No player is above average here yet.
Hacienda
HPS&D
14 maps played2% of the poolBest team Los Angeles Thieves (67%)Best player Mercules
Hardpoint5 played
Best teams
Best players
No player is above average here yet.
6 Star
HPS&D
108 maps played12% of the poolBest team OpTic Texas (92%)Best player Beans
Hardpoint63 played
Best teams
 Toronto Ultra10–471%45–88
Atlanta FaZe7–464%35–85
Best players
Search & Destroy45 played
Best teams
Toronto Ultra9–375%47–91
Atlanta FaZe7–370%40–89
 Seattle Surge5–362%31–86
Best players
Diamondcon5–51.22K/D
Dealership
S&D
41 maps played5% of the poolBest team Miami Heretics (91%)Best player Envoy
Search & Destroy41 played
Best teams
Best players
Highrise
S&DCTRL
145 maps played16% of the poolBest team Toronto Ultra (76%)Best player Scrap
Search & Destroy58 played
Best teams
Atlanta FaZe9–469%42–87
Seattle Surge7–464%35–85
Best players
Lucky7–31.30K/D
Lynz6–31.29K/D
Invasion
S&DCTRL
198 maps played22% of the poolBest team Atlanta FaZe (82%)Best player Scrap
Search & Destroy91 played
Best teams
Seattle Surge11–665%41–83
 New York Subliners14–961%41–78
Toronto Ultra7–558%32–81
Best players
Attach3–101.28K/D
Control107 played
Best teams
Atlanta FaZe23–582%64–92
New York Subliners14–1254%35–71
 Las Vegas Legion8–753%30–75
Best players
Karachi
HPS&DCTRL
239 maps played26% of the poolBest team Toronto Ultra (83%)Best player Drazah
Hardpoint92 played
Best teams
Toronto Ultra19–483%63–93
Atlanta FaZe15–575%53–89
New York Subliners13–1154%35–72
Best players
Clayster8–51.17K/D · 4187 dmg
FeLo7–51.08K/D · 4239 dmg
Search & Destroy70 played
Best teams
Atlanta FaZe7–278%45–94
New York Subliners10–662%39–82
Best players
Control76 played
Best teams
Toronto Ultra11–379%52–92
Atlanta FaZe6–275%41–93
Best players
Priestahh6–31.25K/D · 3876 dmg
Protocol
S&DCTRL
142 maps played16% of the poolBest team Los Angeles Thieves (80%)Best player Mercules
Search & Destroy58 played
Best teams
Atlanta FaZe12–667%44–84
Toronto Ultra10–662%39–82
Best players
Control84 played
Best teams
Atlanta FaZe16–576%55–89
Toronto Ultra12–860%39–78
Best players
Red Card
HPS&D
138 maps played15% of the poolBest team Los Angeles Thieves (91%)Best player Scrap
Hardpoint63 played
Best teams
Atlanta FaZe11–665%41–83
Toronto Ultra4–357%25–84
Best players
Search & Destroy74 played
Best teams
Atlanta FaZe10–567%42–85
Best players
Rewind
HPS&D
62 maps played7% of the poolBest team Los Angeles Thieves (89%)Best player Scrap
Hardpoint29 played
Best teams
Atlanta FaZe5–271%36–92
Best players
Search & Destroy32 played
Best teams
Best players
Rio
HPS&D
114 maps played12% of the poolBest team Atlanta FaZe (82%)Best player Drazah
Hardpoint75 played
Best teams
Atlanta FaZe9–282%52–95
New York Subliners14–767%45–83
Best players
Search & Destroy38 played
Best teams
Atlanta FaZe7–278%45–94
Toronto Ultra7–558%32–81
Las Vegas Legion4–357%25–84
Best players
Skyline
HP
101 maps played11% of the poolBest team Miami Heretics (80%)Best player RenKoR
Hardpoint101 played
Best teams
Toronto Ultra14–574%51–88
Atlanta FaZe6–555%28–79
Best players
Sub Base
HP
62 maps played7% of the poolBest team OpTic Texas (81%)Best player Scrap
Hardpoint62 played
Best teams
Las Vegas Legion4–180%38–96
Toronto Ultra8–467%39–86
Best players
Vault
HPCTRL
193 maps played22% of the poolBest team Minnesota RØKKR (86%)Best player HyDra
Hardpoint92 played
Best teams
Minnesota RØKKR6–186%49–97
Best players
Gio8–31.12K/D · 3318 dmg
Control101 played
Best teams
Minnesota RØKKR5–362%31–86
Toronto Ultra14–961%41–78
 Los Angeles Guerrillas M86–555%28–79
Best players
Vista
HP
51 maps played6% of the poolBest team Seattle Surge (90%)Best player HyDra
Hardpoint51 played
Best teams
Seattle Surge9–190%60–98
Atlanta FaZe9–375%47–91
New York Subliners9–756%33–77
Best players
Vikul5–61.08K/D · 4912 dmg
Team win rates need at least 4 maps on the map in that mode. Players are ranked by the average of their K/D and damage z-scores on the map, among players with enough maps there (see methodology). Players and teams that are no longer active have no profile page, so they appear without a link.
